

378
2017b). Some of the metrics (e.g., density at PCB06) continued to be significantly
below the densities found in previous studies conducted in the northern GoM before
the DWH event until 2015.
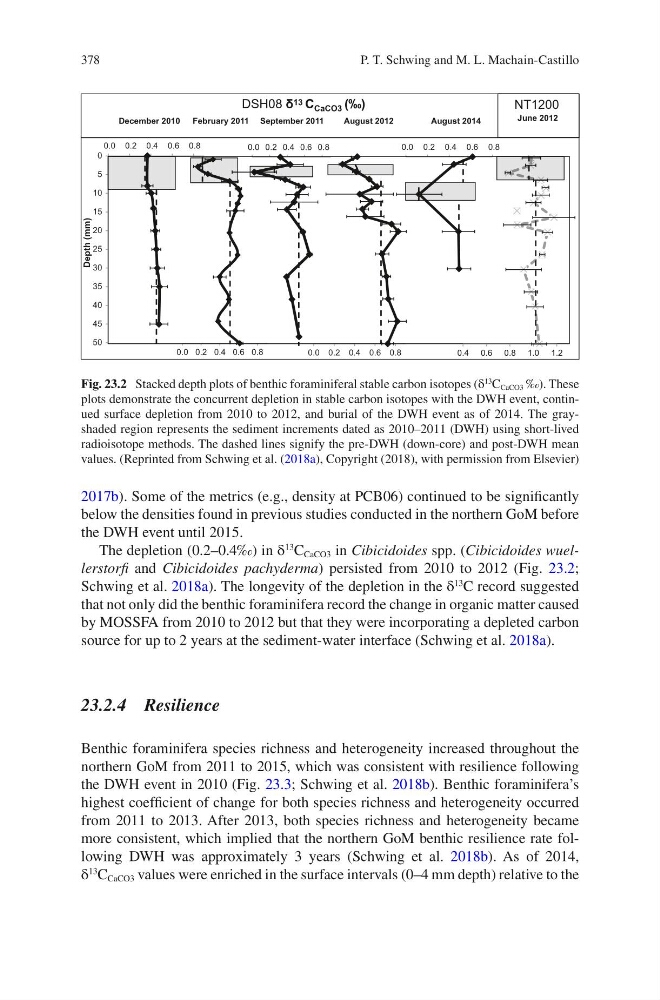
The depletion (0.2–0.4‰) in δ
13
C CaCO3 in Cibicidoides spp. (Cibicidoides wuellerstorfi and Cibicidoides pachyderma) persisted from 2010 to 2012 (Fig. 23.2;
Schwing et al. 2018a). The longevity of the depletion in the δ
13
C record suggested
that not only did the benthic foraminifera record the change in organic matter caused
by MOSSFA from 2010 to 2012 but that they were incorporating a depleted carbon
source for up to 2 years at the sediment-water interface (Schwing et al. 2018a).
23.2.4 Resilience
Benthic foraminifera species richness and heterogeneity increased throughout the
northern GoM from 2011 to 2015, which was consistent with resilience following
the DWH event in 2010 (Fig. 23.3; Schwing et al. 2018b). Benthic foraminifera’s
highest coefficient of change for both species richness and heterogeneity occurred
from 2011 to 2013. After 2013, both species richness and heterogeneity became
more consistent, which implied that the northern GoM benthic resilience rate following DWH was approximately 3 years (Schwing et al. 2018b). As of 2014,
δ
13
C CaCO3 values were enriched in the surface intervals (0–4 mm depth) relative to the
0.0 0.2 0.4 0.6 0.8
August 2012
0.0 0.2 0.4 0.6 0.8
September 2011
0.0 0.2 0.4 0.6 0.8
February 2011
0
5
10
15
20
25
30
35
40
45
50
0.0 0.2 0.4 0.6 0.8
Depth (mm)
December 2010
DSH08 δ 13 C CaCO3 (‰)
0.0 0.2 0.4 0.6 0.8
August 2014
0.4 0.6 0.8 1.0 1.2
June 2012
NT1200
Fig. 23.2 Stacked depth plots of benthic foraminiferal stable carbon isotopes (δ
13
C CaCO3 ‰). These
plots demonstrate the concurrent depletion in stable carbon isotopes with the DWH event, continued surface depletion from 2010 to 2012, and burial of the DWH event as of 2014. The grayshaded region represents the sediment increments dated as 2010–2011 (DWH) using short-lived
radioisotope methods. The dashed lines signify the pre-DWH (down-core) and post-DWH mean
values. (Reprinted from Schwing et al. (2018a), Copyright (2018), with permission from Elsevier)
P. T. Schwing and M. L. Machain-Castillo
2017b). Some of the metrics (e.g., density at PCB06) continued to be significantly
below the densities found in previous studies conducted in the northern GoM before
the DWH event until 2015.
The depletion (0.2–0.4‰) in δ
13
C CaCO3 in Cibicidoides spp. (Cibicidoides wuellerstorfi and Cibicidoides pachyderma) persisted from 2010 to 2012 (Fig. 23.2;
Schwing et al. 2018a). The longevity of the depletion in the δ
13
C record suggested
that not only did the benthic foraminifera record the change in organic matter caused
by MOSSFA from 2010 to 2012 but that they were incorporating a depleted carbon
source for up to 2 years at the sediment-water interface (Schwing et al. 2018a).
23.2.4 Resilience
Benthic foraminifera species richness and heterogeneity increased throughout the
northern GoM from 2011 to 2015, which was consistent with resilience following
the DWH event in 2010 (Fig. 23.3; Schwing et al. 2018b). Benthic foraminifera’s
highest coefficient of change for both species richness and heterogeneity occurred
from 2011 to 2013. After 2013, both species richness and heterogeneity became
more consistent, which implied that the northern GoM benthic resilience rate following DWH was approximately 3 years (Schwing et al. 2018b). As of 2014,
δ
13
C CaCO3 values were enriched in the surface intervals (0–4 mm depth) relative to the
0.0 0.2 0.4 0.6 0.8
August 2012
0.0 0.2 0.4 0.6 0.8
September 2011
0.0 0.2 0.4 0.6 0.8
February 2011
0
5
10
15
20
25
30
35
40
45
50
0.0 0.2 0.4 0.6 0.8
Depth (mm)
December 2010
DSH08 δ 13 C CaCO3 (‰)
0.0 0.2 0.4 0.6 0.8
August 2014
0.4 0.6 0.8 1.0 1.2
June 2012
NT1200
Fig. 23.2 Stacked depth plots of benthic foraminiferal stable carbon isotopes (δ
13
C CaCO3 ‰). These
plots demonstrate the concurrent depletion in stable carbon isotopes with the DWH event, continued surface depletion from 2010 to 2012, and burial of the DWH event as of 2014. The grayshaded region represents the sediment increments dated as 2010–2011 (DWH) using short-lived
radioisotope methods. The dashed lines signify the pre-DWH (down-core) and post-DWH mean
values. (Reprinted from Schwing et al. (2018a), Copyright (2018), with permission from Elsevier)
P. T. Schwing and M. L. Machain-Castillo