

360
individual coral colonies were imaged every year between 2011 and 2017 at the
three impacted sites as well as at two sites that were not affected by the DWH oil
spill (AT 357 and GC 852, 183 and 325 km from the Macondo well at 1050 and
1400 m depths, respectively) (Girard and Fisher 2018; Hsing et al. 2013). Highresolution images were analyzed to characterize the long-term impact of the spill
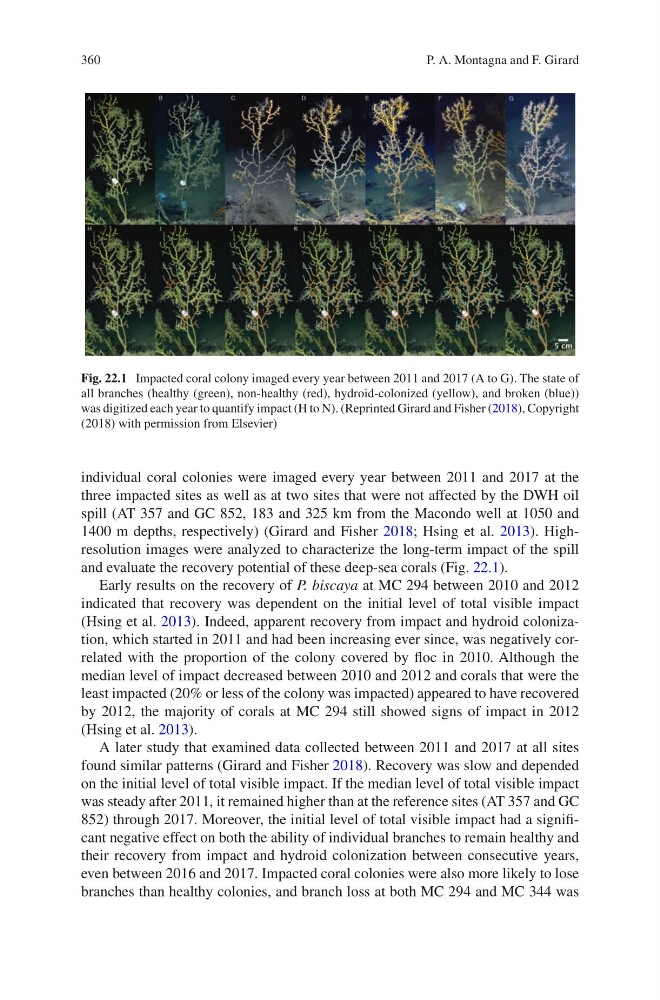
and evaluate the recovery potential of these deep-sea corals (Fig. 22.1).
Early results on the recovery of P. biscaya at MC 294 between 2010 and 2012
indicated that recovery was dependent on the initial level of total visible impact
(Hsing et al. 2013). Indeed, apparent recovery from impact and hydroid colonization, which started in 2011 and had been increasing ever since, was negatively correlated with the proportion of the colony covered by floc in 2010. Although the
median level of impact decreased between 2010 and 2012 and corals that were the
least impacted (20% or less of the colony was impacted) appeared to have recovered
by 2012, the majority of corals at MC 294 still showed signs of impact in 2012
(Hsing et al. 2013).
A later study that examined data collected between 2011 and 2017 at all sites
found similar patterns (Girard and Fisher 2018). Recovery was slow and depended
on the initial level of total visible impact. If the median level of total visible impact
was steady after 2011, it remained higher than at the reference sites (AT 357 and GC
852) through 2017. Moreover, the initial level of total visible impact had a significant negative effect on both the ability of individual branches to remain healthy and
their recovery from impact and hydroid colonization between consecutive years,
even between 2016 and 2017. Impacted coral colonies were also more likely to lose
branches than healthy colonies, and branch loss at both MC 294 and MC 344 was
Fig. 22.1 Impacted coral colony imaged every year between 2011 and 2017 (A to G). The state of
all branches (healthy (green), non-healthy (red), hydroid-colonized (yellow), and broken (blue))
was digitized each year to quantify impact (H to N). (Reprinted Girard and Fisher (2018), Copyright
(2018) with permission from Elsevier)
P. A. Montagna and F. Girard
individual coral colonies were imaged every year between 2011 and 2017 at the
three impacted sites as well as at two sites that were not affected by the DWH oil
spill (AT 357 and GC 852, 183 and 325 km from the Macondo well at 1050 and
1400 m depths, respectively) (Girard and Fisher 2018; Hsing et al. 2013). Highresolution images were analyzed to characterize the long-term impact of the spill
and evaluate the recovery potential of these deep-sea corals (Fig. 22.1).
Early results on the recovery of P. biscaya at MC 294 between 2010 and 2012
indicated that recovery was dependent on the initial level of total visible impact
(Hsing et al. 2013). Indeed, apparent recovery from impact and hydroid colonization, which started in 2011 and had been increasing ever since, was negatively correlated with the proportion of the colony covered by floc in 2010. Although the
median level of impact decreased between 2010 and 2012 and corals that were the
least impacted (20% or less of the colony was impacted) appeared to have recovered
by 2012, the majority of corals at MC 294 still showed signs of impact in 2012
(Hsing et al. 2013).
A later study that examined data collected between 2011 and 2017 at all sites
found similar patterns (Girard and Fisher 2018). Recovery was slow and depended
on the initial level of total visible impact. If the median level of total visible impact
was steady after 2011, it remained higher than at the reference sites (AT 357 and GC
852) through 2017. Moreover, the initial level of total visible impact had a significant negative effect on both the ability of individual branches to remain healthy and
their recovery from impact and hydroid colonization between consecutive years,
even between 2016 and 2017. Impacted coral colonies were also more likely to lose
branches than healthy colonies, and branch loss at both MC 294 and MC 344 was
Fig. 22.1 Impacted coral colony imaged every year between 2011 and 2017 (A to G). The state of
all branches (healthy (green), non-healthy (red), hydroid-colonized (yellow), and broken (blue))
was digitized each year to quantify impact (H to N). (Reprinted Girard and Fisher (2018), Copyright
(2018) with permission from Elsevier)
P. A. Montagna and F. Girard