

277
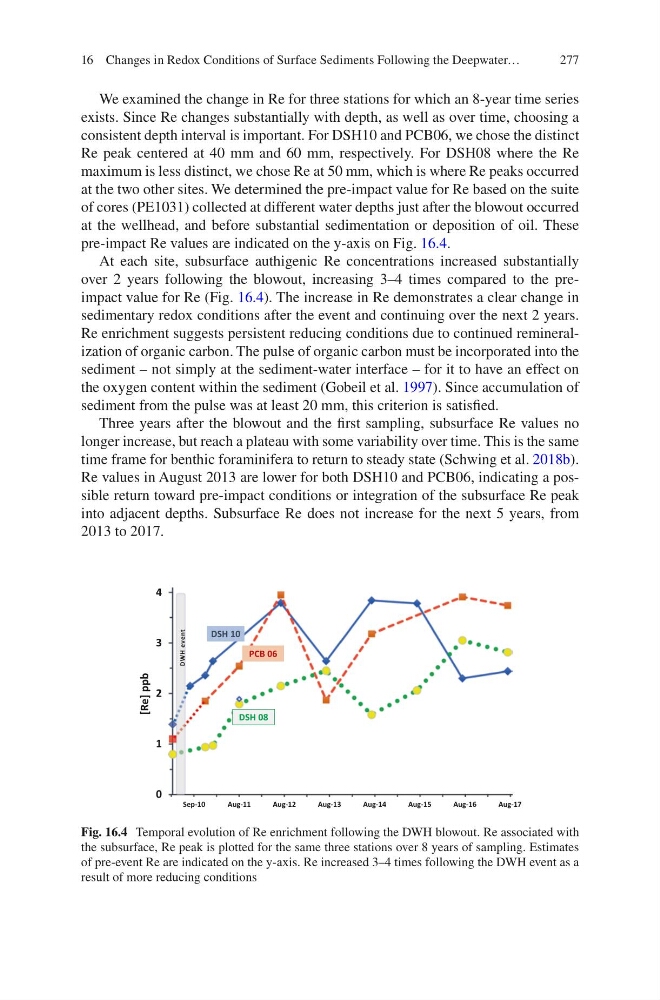
We examined the change in Re for three stations for which an 8-year time series
exists. Since Re changes substantially with depth, as well as over time, choosing a
consistent depth interval is important. For DSH10 and PCB06, we chose the distinct
Re peak centered at 40 mm and 60 mm, respectively. For DSH08 where the Re
maximum is less distinct, we chose Re at 50 mm, which is where Re peaks occurred
at the two other sites. We determined the pre-impact value for Re based on the suite
of cores (PE1031) collected at different water depths just after the blowout occurred
at the wellhead, and before substantial sedimentation or deposition of oil. These
pre-impact Re values are indicated on the y-axis on Fig. 16.4.
At each site, subsurface authigenic Re concentrations increased substantially
over 2 years following the blowout, increasing 3–4 times compared to the preimpact value for Re (Fig. 16.4). The increase in Re demonstrates a clear change in
sedimentary redox conditions after the event and continuing over the next 2 years.
Re enrichment suggests persistent reducing conditions due to continued remineralization of organic carbon. The pulse of organic carbon must be incorporated into the
sediment – not simply at the sediment-water interface – for it to have an effect on
the oxygen content within the sediment (Gobeil et al. 1997). Since accumulation of
sediment from the pulse was at least 20 mm, this criterion is satisfied.
Three years after the blowout and the first sampling, subsurface Re values no
longer increase, but reach a plateau with some variability over time. This is the same
time frame for benthic foraminifera to return to steady state (Schwing et al. 2018b).
Re values in August 2013 are lower for both DSH10 and PCB06, indicating a possible return toward pre-impact conditions or integration of the subsurface Re peak
into adjacent depths. Subsurface Re does not increase for the next 5 years, from
2013 to 2017.
0
1
2
3
4
Sep-10
Aug-11
Aug-12
Aug-13
Aug-14
Aug-15
Aug-16
Aug-17
[Re] ppb
DSH 10
PCB 06
DSH 08
DWH event
Fig. 16.4 Temporal evolution of Re enrichment following the DWH blowout. Re associated with
the subsurface, Re peak is plotted for the same three stations over 8 years of sampling. Estimates
of pre-event Re are indicated on the y-axis. Re increased 3–4 times following the DWH event as a
result of more reducing conditions
16 Changes in Redox Conditions of Surface Sediments Following the Deepwater…
We examined the change in Re for three stations for which an 8-year time series
exists. Since Re changes substantially with depth, as well as over time, choosing a
consistent depth interval is important. For DSH10 and PCB06, we chose the distinct
Re peak centered at 40 mm and 60 mm, respectively. For DSH08 where the Re
maximum is less distinct, we chose Re at 50 mm, which is where Re peaks occurred
at the two other sites. We determined the pre-impact value for Re based on the suite
of cores (PE1031) collected at different water depths just after the blowout occurred
at the wellhead, and before substantial sedimentation or deposition of oil. These
pre-impact Re values are indicated on the y-axis on Fig. 16.4.
At each site, subsurface authigenic Re concentrations increased substantially
over 2 years following the blowout, increasing 3–4 times compared to the preimpact value for Re (Fig. 16.4). The increase in Re demonstrates a clear change in
sedimentary redox conditions after the event and continuing over the next 2 years.
Re enrichment suggests persistent reducing conditions due to continued remineralization of organic carbon. The pulse of organic carbon must be incorporated into the
sediment – not simply at the sediment-water interface – for it to have an effect on
the oxygen content within the sediment (Gobeil et al. 1997). Since accumulation of
sediment from the pulse was at least 20 mm, this criterion is satisfied.
Three years after the blowout and the first sampling, subsurface Re values no
longer increase, but reach a plateau with some variability over time. This is the same
time frame for benthic foraminifera to return to steady state (Schwing et al. 2018b).
Re values in August 2013 are lower for both DSH10 and PCB06, indicating a possible return toward pre-impact conditions or integration of the subsurface Re peak
into adjacent depths. Subsurface Re does not increase for the next 5 years, from
2013 to 2017.
0
1
2
3
4
Sep-10
Aug-11
Aug-12
Aug-13
Aug-14
Aug-15
Aug-16
Aug-17
[Re] ppb
DSH 10
PCB 06
DSH 08
DWH event
Fig. 16.4 Temporal evolution of Re enrichment following the DWH blowout. Re associated with
the subsurface, Re peak is plotted for the same three stations over 8 years of sampling. Estimates
of pre-event Re are indicated on the y-axis. Re increased 3–4 times following the DWH event as a
result of more reducing conditions
16 Changes in Redox Conditions of Surface Sediments Following the Deepwater…