

275
peak increases. The most recent profile at DSH10 reveals a single Mn peak at
20–30 mm, similar to the pre-event profile.
In the December 2010 profile at DSH08, the surface Mn peak is 16 mg/g but
decreases over the next several years of sampling. By 2017, the surface Mn peak
decreased to 6 mg/g Mn. The unusual double Mn peaks are indicative of nonsteadystate behavior, and the pulse of reactive carbon fades over the next 3–5 years reverting back to the canonical single Mn peak. This is the same time frame required for
the diversity of benthic foraminifera to return to steady-state conditions (Schwing
et al. 2018a) and for the incorporation of oil-derived δ
13
C in the foraminiferal tests
to return to steady state (Schwing et al. 2018b).
16.3.3.1 Post-impact: Explanation of Double Mn Peak
The sedimentation pulse mixed with fresh organic carbon would result in increased
microbial respiration with consumption of oxygen and a shoaling or shallowing, of
the redoxcline in the sediments. As the redox boundary migrates upward, a new,
shallower Mn oxide peak would be expected to form, leaving behind a relic Mn
peak at depth. The observation of two or more Mn peaks, and the concept of
nonsteady- state diagenesis, was explored to describe paleoredox variations and
changes in paleoproductivity (Finney et al. 1988), in the modern carbon cycle
(Kuzyk et al. 2011), and in turbidite sequences in the North East Atlantic (Colley
et al. 1984; Thomson et al. 1993). Pulsed sedimentation to the seafloor is not uncommon (e.g., Honjo et al. 1982; Gobeil et al. 1997; Gobeil et al. 2001). It is worth
0
10
20
30
0
1 0
2 0
Depth (mm)
Mn (mg/g)
0.0
0 .5
1.0
Re (ppb)
0
50
100
150
200
0
1 0
2 0
Depth (mm)
0.0
1 .0
2.0
a) DSH 10; Aug 2010
MnOx
MnOx
Reducing: Mn depletion Re enrichment
0
10
20
30
0
1 0
2 0
3 0
Depth (mm)
Mn (mg/g)
0.0
0 .5
1.0
Re (ppb)
0
50
100
150
200
0
1 0
2 0
3 0
Depth (mm)
0
1
2
3
4
b) DSH 10; Aug 2012
Reducing: Mn depletion Re enrichment
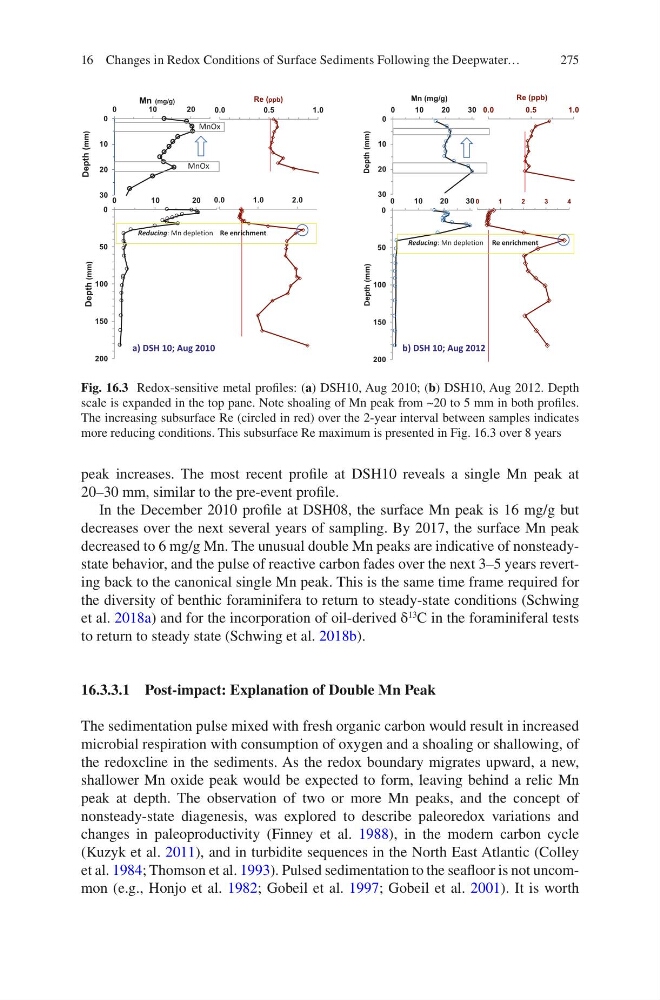
Fig. 16.3 Redox-sensitive metal profiles: (a) DSH10, Aug 2010; (b) DSH10, Aug 2012. Depth
scale is expanded in the top pane. Note shoaling of Mn peak from ~20 to 5 mm in both profiles.
The increasing subsurface Re (circled in red) over the 2-year interval between samples indicates
more reducing conditions. This subsurface Re maximum is presented in Fig. 16.3 over 8 years
16 Changes in Redox Conditions of Surface Sediments Following the Deepwater…
peak increases. The most recent profile at DSH10 reveals a single Mn peak at
20–30 mm, similar to the pre-event profile.
In the December 2010 profile at DSH08, the surface Mn peak is 16 mg/g but
decreases over the next several years of sampling. By 2017, the surface Mn peak
decreased to 6 mg/g Mn. The unusual double Mn peaks are indicative of nonsteadystate behavior, and the pulse of reactive carbon fades over the next 3–5 years reverting back to the canonical single Mn peak. This is the same time frame required for
the diversity of benthic foraminifera to return to steady-state conditions (Schwing
et al. 2018a) and for the incorporation of oil-derived δ
13
C in the foraminiferal tests
to return to steady state (Schwing et al. 2018b).
16.3.3.1 Post-impact: Explanation of Double Mn Peak
The sedimentation pulse mixed with fresh organic carbon would result in increased
microbial respiration with consumption of oxygen and a shoaling or shallowing, of
the redoxcline in the sediments. As the redox boundary migrates upward, a new,
shallower Mn oxide peak would be expected to form, leaving behind a relic Mn
peak at depth. The observation of two or more Mn peaks, and the concept of
nonsteady- state diagenesis, was explored to describe paleoredox variations and
changes in paleoproductivity (Finney et al. 1988), in the modern carbon cycle
(Kuzyk et al. 2011), and in turbidite sequences in the North East Atlantic (Colley
et al. 1984; Thomson et al. 1993). Pulsed sedimentation to the seafloor is not uncommon (e.g., Honjo et al. 1982; Gobeil et al. 1997; Gobeil et al. 2001). It is worth
0
10
20
30
0
1 0
2 0
Depth (mm)
Mn (mg/g)
0.0
0 .5
1.0
Re (ppb)
0
50
100
150
200
0
1 0
2 0
Depth (mm)
0.0
1 .0
2.0
a) DSH 10; Aug 2010
MnOx
MnOx
Reducing: Mn depletion Re enrichment
0
10
20
30
0
1 0
2 0
3 0
Depth (mm)
Mn (mg/g)
0.0
0 .5
1.0
Re (ppb)
0
50
100
150
200
0
1 0
2 0
3 0
Depth (mm)
0
1
2
3
4
b) DSH 10; Aug 2012
Reducing: Mn depletion Re enrichment
Fig. 16.3 Redox-sensitive metal profiles: (a) DSH10, Aug 2010; (b) DSH10, Aug 2012. Depth
scale is expanded in the top pane. Note shoaling of Mn peak from ~20 to 5 mm in both profiles.
The increasing subsurface Re (circled in red) over the 2-year interval between samples indicates
more reducing conditions. This subsurface Re maximum is presented in Fig. 16.3 over 8 years
16 Changes in Redox Conditions of Surface Sediments Following the Deepwater…