

237
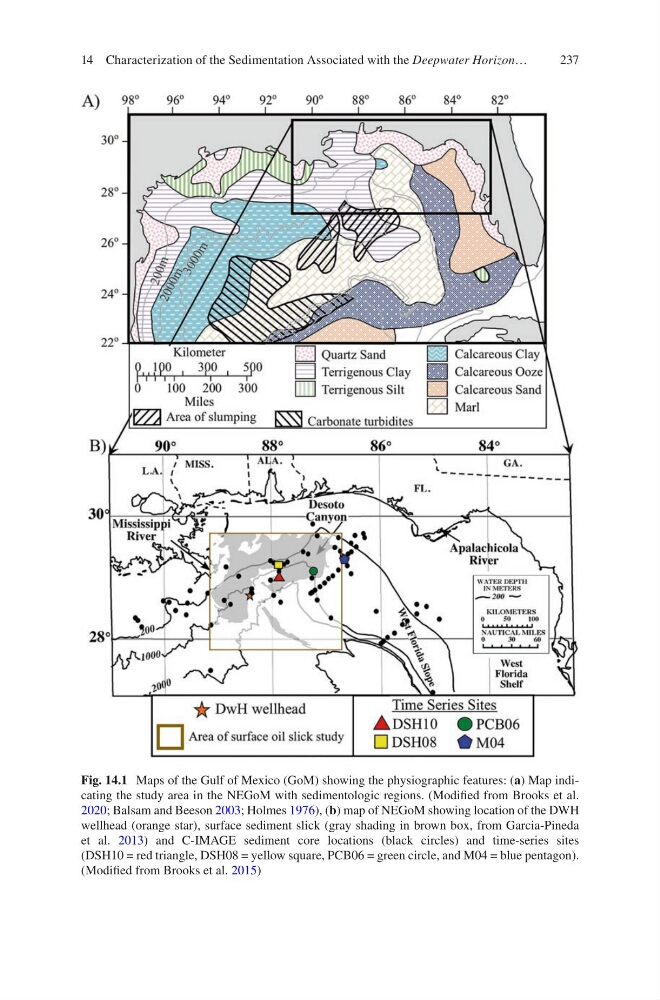
Fig. 14.1 Maps of the Gulf of Mexico (GoM) showing the physiographic features: (a) Map indicating the study area in the NEGoM with sedimentologic regions. (Modified from Brooks et al.
2020; Balsam and Beeson 2003; Holmes 1976), (b) map of NEGoM showing location of the DWH
wellhead (orange star), surface sediment slick (gray shading in brown box, from Garcia-Pineda
et al. 2013) and C-IMAGE sediment core locations (black circles) and time-series sites
(DSH10 = red triangle, DSH08 = yellow square, PCB06 = green circle, and M04 = blue pentagon).
(Modified from Brooks et al. 2015)
14 Characterization of the Sedimentation Associated with the Deepwater Horizon…
Fig. 14.1 Maps of the Gulf of Mexico (GoM) showing the physiographic features: (a) Map indicating the study area in the NEGoM with sedimentologic regions. (Modified from Brooks et al.
2020; Balsam and Beeson 2003; Holmes 1976), (b) map of NEGoM showing location of the DWH
wellhead (orange star), surface sediment slick (gray shading in brown box, from Garcia-Pineda
et al. 2013) and C-IMAGE sediment core locations (black circles) and time-series sites
(DSH10 = red triangle, DSH08 = yellow square, PCB06 = green circle, and M04 = blue pentagon).
(Modified from Brooks et al. 2015)
14 Characterization of the Sedimentation Associated with the Deepwater Horizon…