

184
identical; however, this model configuration is the same for all scenarios. Clearly,
DB_VDROPJ_untreated scenario is unrealistic with no secondary intrusions or oil
in the water column (Diercks et al. 2010; Wade et al. 2016). Differential oil content
demonstrates non-negligible values in the top 20-m layer only as well as being less
consistent with time progression. The lack of distinct plume-like vertical structure
in the interior also calls into question the validity of the DSDs produced by VDROP-J
model for the DWH scenario.
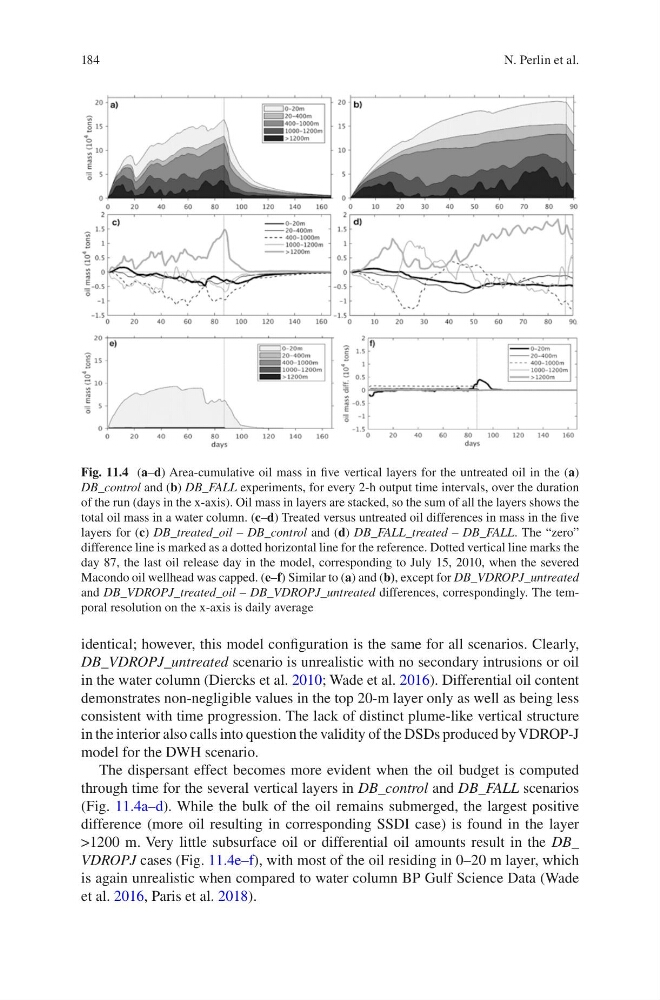
The dispersant effect becomes more evident when the oil budget is computed
through time for the several vertical layers in DB_control and DB_FALL scenarios
(Fig. 11.4a–d). While the bulk of the oil remains submerged, the largest positive
difference (more oil resulting in corresponding SSDI case) is found in the layer
>1200 m. Very little subsurface oil or differential oil amounts result in the DB_
VDROPJ cases (Fig. 11.4e–f), with most of the oil residing in 0–20 m layer, which
is again unrealistic when compared to water column BP Gulf Science Data (Wade
et al. 2016, Paris et al. 2018).
Fig. 11.4 (a–d) Area-cumulative oil mass in five vertical layers for the untreated oil in the (a)
DB_control and (b) DB_FALL experiments, for every 2-h output time intervals, over the duration
of the run (days in the x-axis). Oil mass in layers are stacked, so the sum of all the layers shows the
total oil mass in a water column. (c–d) Treated versus untreated oil differences in mass in the five
layers for (c) DB_treated_oil – DB_control and (d) DB_FALL_treated – DB_FALL. The “zero”
difference line is marked as a dotted horizontal line for the reference. Dotted vertical line marks the
day 87, the last oil release day in the model, corresponding to July 15, 2010, when the severed
Macondo oil wellhead was capped. (e–f) Similar to (a) and (b), except for DB_VDROPJ_untreated
and DB_VDROPJ_treated_oil – DB_VDROPJ_untreated differences, correspondingly. The temporal resolution on the x-axis is daily average
N. Perlin et al.
identical; however, this model configuration is the same for all scenarios. Clearly,
DB_VDROPJ_untreated scenario is unrealistic with no secondary intrusions or oil
in the water column (Diercks et al. 2010; Wade et al. 2016). Differential oil content
demonstrates non-negligible values in the top 20-m layer only as well as being less
consistent with time progression. The lack of distinct plume-like vertical structure
in the interior also calls into question the validity of the DSDs produced by VDROP-J
model for the DWH scenario.
The dispersant effect becomes more evident when the oil budget is computed
through time for the several vertical layers in DB_control and DB_FALL scenarios
(Fig. 11.4a–d). While the bulk of the oil remains submerged, the largest positive
difference (more oil resulting in corresponding SSDI case) is found in the layer
>1200 m. Very little subsurface oil or differential oil amounts result in the DB_
VDROPJ cases (Fig. 11.4e–f), with most of the oil residing in 0–20 m layer, which
is again unrealistic when compared to water column BP Gulf Science Data (Wade
et al. 2016, Paris et al. 2018).
Fig. 11.4 (a–d) Area-cumulative oil mass in five vertical layers for the untreated oil in the (a)
DB_control and (b) DB_FALL experiments, for every 2-h output time intervals, over the duration
of the run (days in the x-axis). Oil mass in layers are stacked, so the sum of all the layers shows the
total oil mass in a water column. (c–d) Treated versus untreated oil differences in mass in the five
layers for (c) DB_treated_oil – DB_control and (d) DB_FALL_treated – DB_FALL. The “zero”
difference line is marked as a dotted horizontal line for the reference. Dotted vertical line marks the
day 87, the last oil release day in the model, corresponding to July 15, 2010, when the severed
Macondo oil wellhead was capped. (e–f) Similar to (a) and (b), except for DB_VDROPJ_untreated
and DB_VDROPJ_treated_oil – DB_VDROPJ_untreated differences, correspondingly. The temporal resolution on the x-axis is daily average
N. Perlin et al.