

145
considered to accurately predict the surface slicks (Reed et al. 1999; Le Hénaff et al.
2012; Perlin et al. 2020). The droplet terminal velocity is obtained from a relationship
involving their buoyancy as a function of density, size, and shape (i.e., Reynolds
number) and the ambient fluid viscosity and density (Clift et al. 1978; Zheng et al.
2003; Chen and Yapa 2003; Yapa et al. 2010). The oil-CMS uses the shape classification from Clift et al. (1978) modified by Zheng et al. (2003), working with
particles in the ellipsoidal and spherical regimes (Paris et al. 2012, Perlin et al.
2020). Consequently, the droplet volume median diameter (d 50 ) provided by the
near-field to the far- field model is a critical parameter for reliable predictions of the
distribution and fate of petroleum compounds.
To couple near- and far-field models, it is also necessary to convert the near-field
model output into the far-field Lagrangian input while conserving mass balance.
Commonly, near-field models output the flow rate given as a mass flow rate (kg/s)
for each droplet size (Gros et al. 2017; Dissanayake et al. 2018). This mass flow rate
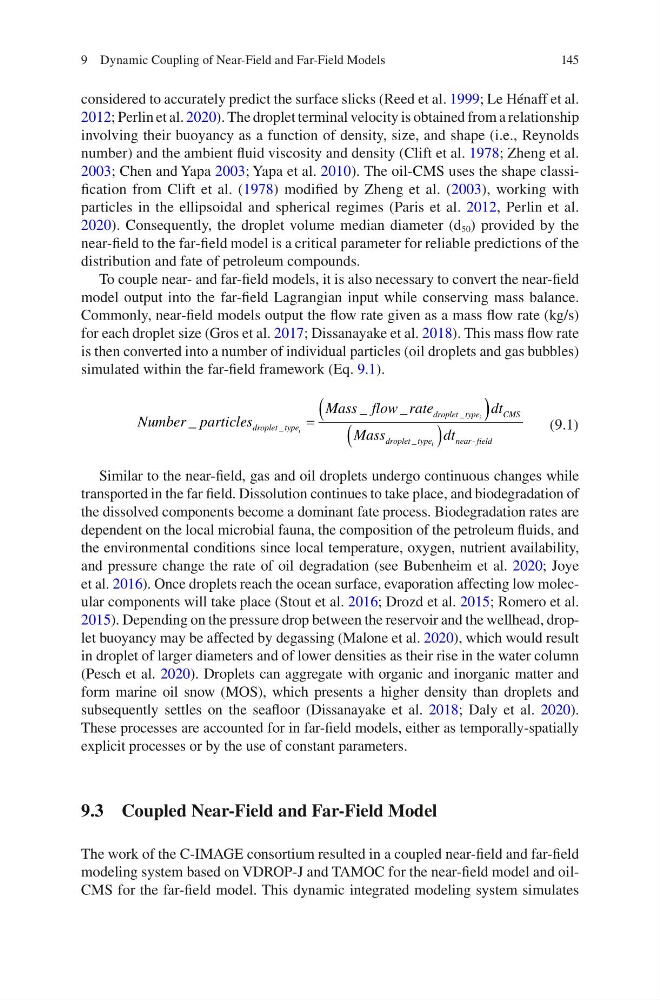
is then converted into a number of individual particles (oil droplets and gas bubbles)
simulated within the far-field framework (Eq. 9.1).
Number particles
Mass flow rate
droplet type
droplet type
i
i
_
_
_
_
_
=
(
) )
(
)
dt
Mass
dt
CMS
droplet type
ear field
i
_
n -
(9.1)
Similar to the near-field, gas and oil droplets undergo continuous changes while
transported in the far field. Dissolution continues to take place, and biodegradation of
the dissolved components become a dominant fate process. Biodegradation rates are
dependent on the local microbial fauna, the composition of the petroleum fluids, and
the environmental conditions since local temperature, oxygen, nutrient availability,
and pressure change the rate of oil degradation (see Bubenheim et al. 2020; Joye
et al. 2016). Once droplets reach the ocean surface, evaporation affecting low molecular components will take place (Stout et al. 2016; Drozd et al. 2015; Romero et al.
2015). Depending on the pressure drop between the reservoir and the wellhead, droplet buoyancy may be affected by degassing (Malone et al. 2020), which would result
in droplet of larger diameters and of lower densities as their rise in the water column
(Pesch et al. 2020). Droplets can aggregate with organic and inorganic matter and
form marine oil snow (MOS), which presents a higher density than droplets and
subsequently settles on the seafloor (Dissanayake et al. 2018; Daly et al. 2020).
These processes are accounted for in far-field models, either as temporally- spatially
explicit processes or by the use of constant parameters.
9.3 Coupled Near-Field and Far-Field Model
The work of the C-IMAGE consortium resulted in a coupled near-field and far-field
modeling system based on VDROP-J and TAMOC for the near-field model and oilCMS for the far-field model. This dynamic integrated modeling system simulates
9 Dynamic Coupling of Near-Field and Far-Field Models
considered to accurately predict the surface slicks (Reed et al. 1999; Le Hénaff et al.
2012; Perlin et al. 2020). The droplet terminal velocity is obtained from a relationship
involving their buoyancy as a function of density, size, and shape (i.e., Reynolds
number) and the ambient fluid viscosity and density (Clift et al. 1978; Zheng et al.
2003; Chen and Yapa 2003; Yapa et al. 2010). The oil-CMS uses the shape classification from Clift et al. (1978) modified by Zheng et al. (2003), working with
particles in the ellipsoidal and spherical regimes (Paris et al. 2012, Perlin et al.
2020). Consequently, the droplet volume median diameter (d 50 ) provided by the
near-field to the far- field model is a critical parameter for reliable predictions of the
distribution and fate of petroleum compounds.
To couple near- and far-field models, it is also necessary to convert the near-field
model output into the far-field Lagrangian input while conserving mass balance.
Commonly, near-field models output the flow rate given as a mass flow rate (kg/s)
for each droplet size (Gros et al. 2017; Dissanayake et al. 2018). This mass flow rate
is then converted into a number of individual particles (oil droplets and gas bubbles)
simulated within the far-field framework (Eq. 9.1).
Number particles
Mass flow rate
droplet type
droplet type
i
i
_
_
_
_
_
=
(
) )
(
)
dt
Mass
dt
CMS
droplet type
ear field
i
_
n -
(9.1)
Similar to the near-field, gas and oil droplets undergo continuous changes while
transported in the far field. Dissolution continues to take place, and biodegradation of
the dissolved components become a dominant fate process. Biodegradation rates are
dependent on the local microbial fauna, the composition of the petroleum fluids, and
the environmental conditions since local temperature, oxygen, nutrient availability,
and pressure change the rate of oil degradation (see Bubenheim et al. 2020; Joye
et al. 2016). Once droplets reach the ocean surface, evaporation affecting low molecular components will take place (Stout et al. 2016; Drozd et al. 2015; Romero et al.
2015). Depending on the pressure drop between the reservoir and the wellhead, droplet buoyancy may be affected by degassing (Malone et al. 2020), which would result
in droplet of larger diameters and of lower densities as their rise in the water column
(Pesch et al. 2020). Droplets can aggregate with organic and inorganic matter and
form marine oil snow (MOS), which presents a higher density than droplets and
subsequently settles on the seafloor (Dissanayake et al. 2018; Daly et al. 2020).
These processes are accounted for in far-field models, either as temporally- spatially
explicit processes or by the use of constant parameters.
9.3 Coupled Near-Field and Far-Field Model
The work of the C-IMAGE consortium resulted in a coupled near-field and far-field
modeling system based on VDROP-J and TAMOC for the near-field model and oilCMS for the far-field model. This dynamic integrated modeling system simulates
9 Dynamic Coupling of Near-Field and Far-Field Models