

1.1 Background
7
provide information that is needed for national assessments and decision
making. Aquatic effects inventory and monitoring for atmospheric deposition
effects in the United States have historically focused on both lakes and streams.
To the extent practical, this book describes attributes and methods that are
applicable to both lakes and streams and that can be applied throughout most
or all regions of the United States. This book addresses which of the sensitive
surface water receptors, and associated field, laboratory, and data analysis
approaches, are most useful for meeting specified objectives.
1.1.1.1 Sensitive Chemical Indicators of Water Quality
Acidification sensitivity and level of effect are commonly evaluated using
several chemical criteria, especially ANC, pH, and Al i . Sensitivity of surface
waters to chronic and episodic acidification depends on watershed soil characteristics, mineralogy, and hydrologic flow paths within the watershed (Chen
et al. 1984, Cosby et al. 1985), as well as on the current and historic atmospheric deposition loadings of acids and bases. Surface water ANC provides
an initial point of departure from which to assess quantitatively the current
status of stream or lake chemistry. Biological effects of acidification have been
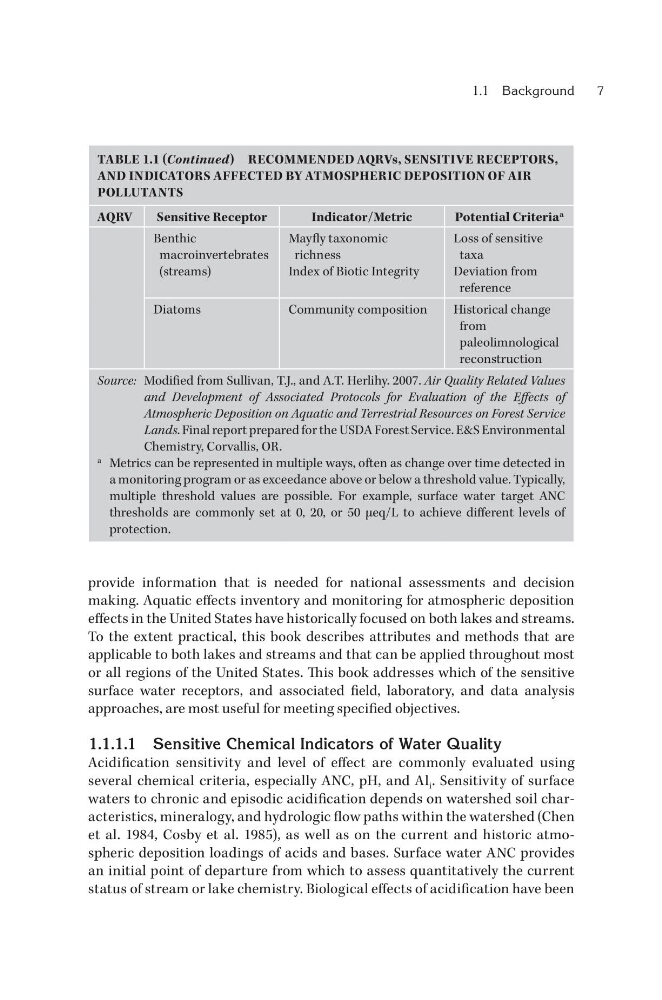
TABLE 1.1 (Continued) RECOMMENDED AQRVs, SENSITIVE RECEPTORS,
AND INDICATORS AFFECTED BY ATMOSPHERIC DEPOSITION OF AIR
POLLUTANTS
AQRV
Sensitive Receptor
Indicator/Metric
Potential Criteria a
Benthic
macroinvertebrates
(streams)
Mayfly taxonomic
richness
Index of Biotic Integrity
Loss of sensitive
taxa
Deviation from
reference
Diatoms
Community composition
Historical change
from
paleolimnological
reconstruction
Source: Modified from Sullivan, T.J., and A.T. Herlihy. 2007. Air Quality Related Values
and Development of Associated Protocols for Evaluation of the Effects of
Atmospheric Deposition on Aquatic and Terrestrial Resources on Forest Service
Lands. Final report prepared for the USDA Forest Service. E&S Environmental
Chemistry, Corvallis, OR.
a Metrics can be represented in multiple ways, often as change over time detected in
a monitoring program or as exceedance above or below a threshold value. Typically,
multiple threshold values are possible. For example, surface water target ANC
thresholds are commonly set at 0, 20, or 50 μeq/L to achieve different levels of
protection.
7
provide information that is needed for national assessments and decision
making. Aquatic effects inventory and monitoring for atmospheric deposition
effects in the United States have historically focused on both lakes and streams.
To the extent practical, this book describes attributes and methods that are
applicable to both lakes and streams and that can be applied throughout most
or all regions of the United States. This book addresses which of the sensitive
surface water receptors, and associated field, laboratory, and data analysis
approaches, are most useful for meeting specified objectives.
1.1.1.1 Sensitive Chemical Indicators of Water Quality
Acidification sensitivity and level of effect are commonly evaluated using
several chemical criteria, especially ANC, pH, and Al i . Sensitivity of surface
waters to chronic and episodic acidification depends on watershed soil characteristics, mineralogy, and hydrologic flow paths within the watershed (Chen
et al. 1984, Cosby et al. 1985), as well as on the current and historic atmospheric deposition loadings of acids and bases. Surface water ANC provides
an initial point of departure from which to assess quantitatively the current
status of stream or lake chemistry. Biological effects of acidification have been
TABLE 1.1 (Continued) RECOMMENDED AQRVs, SENSITIVE RECEPTORS,
AND INDICATORS AFFECTED BY ATMOSPHERIC DEPOSITION OF AIR
POLLUTANTS
AQRV
Sensitive Receptor
Indicator/Metric
Potential Criteria a
Benthic
macroinvertebrates
(streams)
Mayfly taxonomic
richness
Index of Biotic Integrity
Loss of sensitive
taxa
Deviation from
reference
Diatoms
Community composition
Historical change
from
paleolimnological
reconstruction
Source: Modified from Sullivan, T.J., and A.T. Herlihy. 2007. Air Quality Related Values
and Development of Associated Protocols for Evaluation of the Effects of
Atmospheric Deposition on Aquatic and Terrestrial Resources on Forest Service
Lands. Final report prepared for the USDA Forest Service. E&S Environmental
Chemistry, Corvallis, OR.
a Metrics can be represented in multiple ways, often as change over time detected in
a monitoring program or as exceedance above or below a threshold value. Typically,
multiple threshold values are possible. For example, surface water target ANC
thresholds are commonly set at 0, 20, or 50 μeq/L to achieve different levels of
protection.