

Literature review
17
III. Characterization of chitin and chitosan
Fourier transform infrared spectroscopy (FTIR) is a powerful analytical technique used to
investigate the functional groups and chemical bonding in a wide range of materials.
In the case of chitin and chitosan, FTIR analysis provides valuable information about the
chemical composition, purity, and degree of deacetylation of the samples. The FTIR spectra of
chitin and chitosan are characterized by distinct absorption peaks corresponding to specific
functional groups, such as carbonyl, amide, and hydroxyl groups. These peaks can be used to
identify and quantify the different components of the samples and to monitor changes in their
chemical structure and composition under different conditions. (THOMAS et al., 2020)
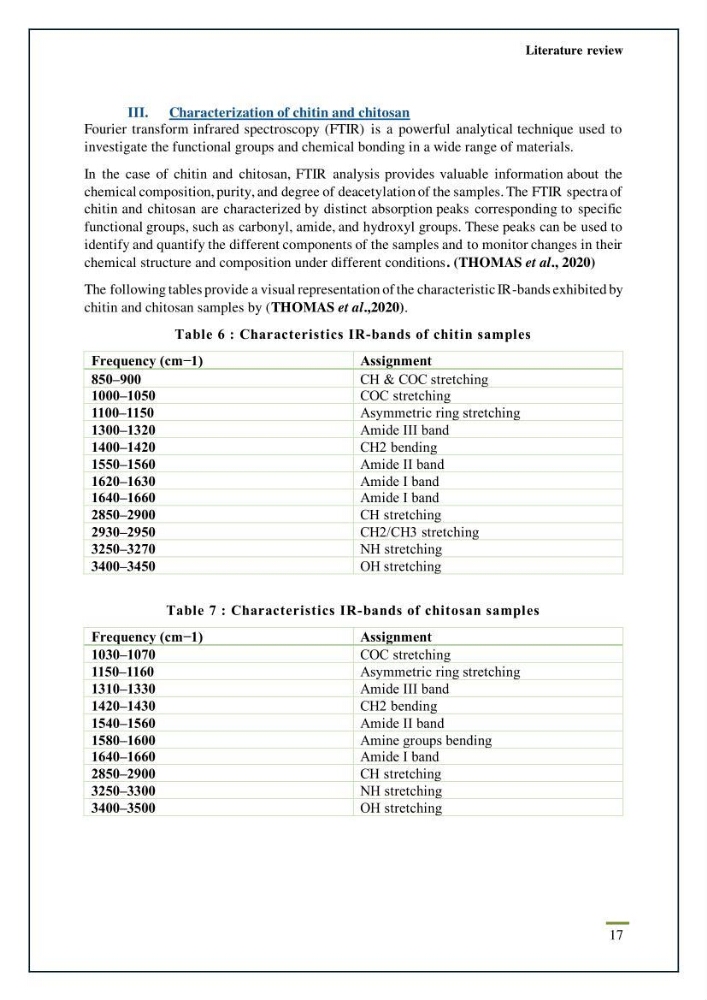
The following tables provide a visual representation of the characteristic IR-bands exhibited by
chitin and chitosan samples by (THOMAS et al.,2020).
Table 6 : Characteristics IR-bands of chitin samples
Frequency (cm−1)
Assignment
850–900
CH & COC stretching
1000–1050
COC stretching
1100–1150
Asymmetric ring stretching
1300–1320
Amide III band
1400–1420
CH2 bending
1550–1560
Amide II band
1620–1630
Amide I band
1640–1660
Amide I band
2850–2900
CH stretching
2930–2950
CH2/CH3 stretching
3250–3270
NH stretching
3400–3450
OH stretching
Table 7 : Characteristics IR-bands of chitosan samples
Frequency (cm−1)
Assignment
1030–1070
COC stretching
1150–1160
Asymmetric ring stretching
1310–1330
Amide III band
1420–1430
CH2 bending
1540–1560
Amide II band
1580–1600
Amine groups bending
1640–1660
Amide I band
2850–2900
CH stretching
3250–3300
NH stretching
3400–3500
OH stretching
17
III. Characterization of chitin and chitosan
Fourier transform infrared spectroscopy (FTIR) is a powerful analytical technique used to
investigate the functional groups and chemical bonding in a wide range of materials.
In the case of chitin and chitosan, FTIR analysis provides valuable information about the
chemical composition, purity, and degree of deacetylation of the samples. The FTIR spectra of
chitin and chitosan are characterized by distinct absorption peaks corresponding to specific
functional groups, such as carbonyl, amide, and hydroxyl groups. These peaks can be used to
identify and quantify the different components of the samples and to monitor changes in their
chemical structure and composition under different conditions. (THOMAS et al., 2020)
The following tables provide a visual representation of the characteristic IR-bands exhibited by
chitin and chitosan samples by (THOMAS et al.,2020).
Table 6 : Characteristics IR-bands of chitin samples
Frequency (cm−1)
Assignment
850–900
CH & COC stretching
1000–1050
COC stretching
1100–1150
Asymmetric ring stretching
1300–1320
Amide III band
1400–1420
CH2 bending
1550–1560
Amide II band
1620–1630
Amide I band
1640–1660
Amide I band
2850–2900
CH stretching
2930–2950
CH2/CH3 stretching
3250–3270
NH stretching
3400–3450
OH stretching
Table 7 : Characteristics IR-bands of chitosan samples
Frequency (cm−1)
Assignment
1030–1070
COC stretching
1150–1160
Asymmetric ring stretching
1310–1330
Amide III band
1420–1430
CH2 bending
1540–1560
Amide II band
1580–1600
Amine groups bending
1640–1660
Amide I band
2850–2900
CH stretching
3250–3300
NH stretching
3400–3500
OH stretching