

Chapter II
Extreme Events
24
Equation II-5
Threshold selection
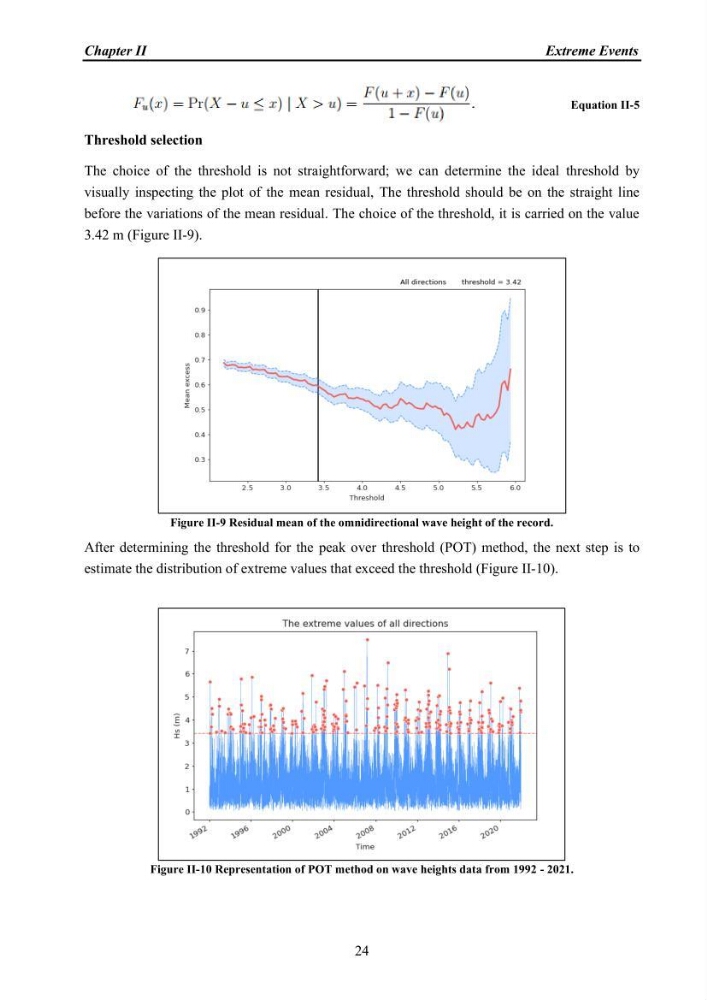
The choice of the threshold is not straightforward; we can determine the ideal threshold by
visually inspecting the plot of the mean residual, The threshold should be on the straight line
before the variations of the mean residual. The choice of the threshold, it is carried on the value
3.42 m (Figure II-9).
Figure II-9 Residual mean of the omnidirectional wave height of the record.
After determining the threshold for the peak over threshold (POT) method, the next step is to
estimate the distribution of extreme values that exceed the threshold (Figure II-10).
Figure II-10 Representation of POT method on wave heights data from 1992 - 2021.
Extreme Events
24
Equation II-5
Threshold selection
The choice of the threshold is not straightforward; we can determine the ideal threshold by
visually inspecting the plot of the mean residual, The threshold should be on the straight line
before the variations of the mean residual. The choice of the threshold, it is carried on the value
3.42 m (Figure II-9).
Figure II-9 Residual mean of the omnidirectional wave height of the record.
After determining the threshold for the peak over threshold (POT) method, the next step is to
estimate the distribution of extreme values that exceed the threshold (Figure II-10).
Figure II-10 Representation of POT method on wave heights data from 1992 - 2021.