

Chapter II
Extreme Events
22
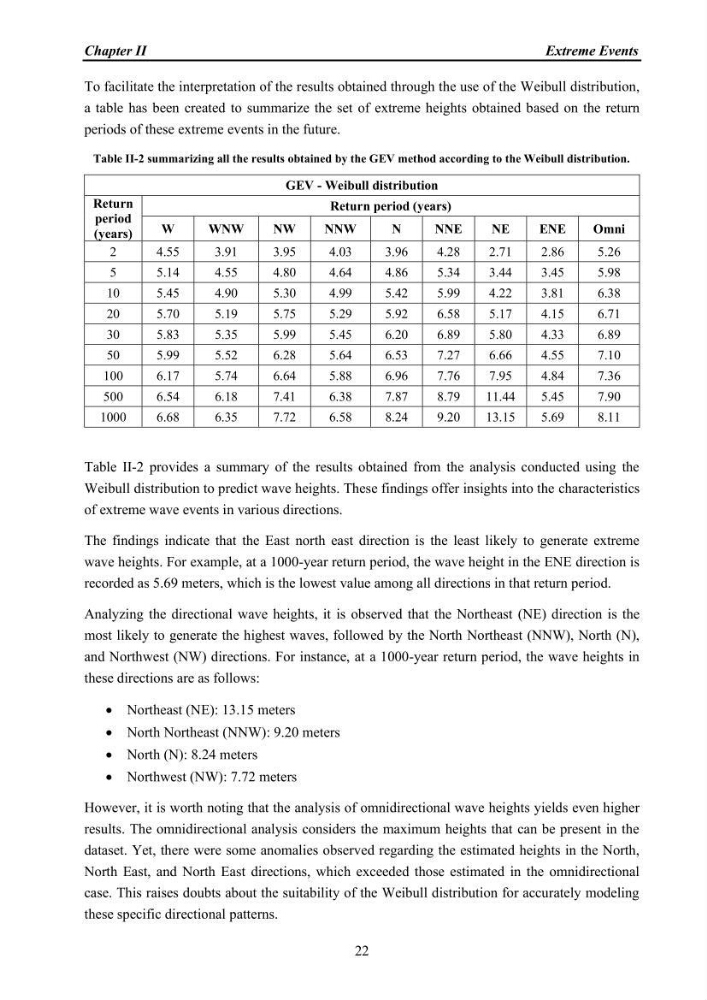
To facilitate the interpretation of the results obtained through the use of the Weibull distribution,
a table has been created to summarize the set of extreme heights obtained based on the return
periods of these extreme events in the future.
Table II-2 summarizing all the results obtained by the GEV method according to the Weibull distribution.
GEV - Weibull distribution
Return
period
(years)
Return period (years)
W
WNW
NW
NNW
N
NNE
NE
ENE
Omni
2
4.55
3.91
3.95
4.03
3.96
4.28
2.71
2.86
5.26
5
5.14
4.55
4.80
4.64
4.86
5.34
3.44
3.45
5.98
10
5.45
4.90
5.30
4.99
5.42
5.99
4.22
3.81
6.38
20
5.70
5.19
5.75
5.29
5.92
6.58
5.17
4.15
6.71
30
5.83
5.35
5.99
5.45
6.20
6.89
5.80
4.33
6.89
50
5.99
5.52
6.28
5.64
6.53
7.27
6.66
4.55
7.10
100
6.17
5.74
6.64
5.88
6.96
7.76
7.95
4.84
7.36
500
6.54
6.18
7.41
6.38
7.87
8.79
11.44
5.45
7.90
1000
6.68
6.35
7.72
6.58
8.24
9.20
13.15
5.69
8.11
Table II-2 provides a summary of the results obtained from the analysis conducted using the
Weibull distribution to predict wave heights. These findings offer insights into the characteristics
of extreme wave events in various directions.
The findings indicate that the East north east direction is the least likely to generate extreme
wave heights. For example, at a 1000-year return period, the wave height in the ENE direction is
recorded as 5.69 meters, which is the lowest value among all directions in that return period.
Analyzing the directional wave heights, it is observed that the Northeast (NE) direction is the
most likely to generate the highest waves, followed by the North Northeast (NNW), North (N),
and Northwest (NW) directions. For instance, at a 1000-year return period, the wave heights in
these directions are as follows:
• Northeast (NE): 13.15 meters
• North Northeast (NNW): 9.20 meters
• North (N): 8.24 meters
• Northwest (NW): 7.72 meters
However, it is worth noting that the analysis of omnidirectional wave heights yields even higher
results. The omnidirectional analysis considers the maximum heights that can be present in the
dataset. Yet, there were some anomalies observed regarding the estimated heights in the North,
North East, and North East directions, which exceeded those estimated in the omnidirectional
case. This raises doubts about the suitability of the Weibull distribution for accurately modeling
these specific directional patterns.
Extreme Events
22
To facilitate the interpretation of the results obtained through the use of the Weibull distribution,
a table has been created to summarize the set of extreme heights obtained based on the return
periods of these extreme events in the future.
Table II-2 summarizing all the results obtained by the GEV method according to the Weibull distribution.
GEV - Weibull distribution
Return
period
(years)
Return period (years)
W
WNW
NW
NNW
N
NNE
NE
ENE
Omni
2
4.55
3.91
3.95
4.03
3.96
4.28
2.71
2.86
5.26
5
5.14
4.55
4.80
4.64
4.86
5.34
3.44
3.45
5.98
10
5.45
4.90
5.30
4.99
5.42
5.99
4.22
3.81
6.38
20
5.70
5.19
5.75
5.29
5.92
6.58
5.17
4.15
6.71
30
5.83
5.35
5.99
5.45
6.20
6.89
5.80
4.33
6.89
50
5.99
5.52
6.28
5.64
6.53
7.27
6.66
4.55
7.10
100
6.17
5.74
6.64
5.88
6.96
7.76
7.95
4.84
7.36
500
6.54
6.18
7.41
6.38
7.87
8.79
11.44
5.45
7.90
1000
6.68
6.35
7.72
6.58
8.24
9.20
13.15
5.69
8.11
Table II-2 provides a summary of the results obtained from the analysis conducted using the
Weibull distribution to predict wave heights. These findings offer insights into the characteristics
of extreme wave events in various directions.
The findings indicate that the East north east direction is the least likely to generate extreme
wave heights. For example, at a 1000-year return period, the wave height in the ENE direction is
recorded as 5.69 meters, which is the lowest value among all directions in that return period.
Analyzing the directional wave heights, it is observed that the Northeast (NE) direction is the
most likely to generate the highest waves, followed by the North Northeast (NNW), North (N),
and Northwest (NW) directions. For instance, at a 1000-year return period, the wave heights in
these directions are as follows:
• Northeast (NE): 13.15 meters
• North Northeast (NNW): 9.20 meters
• North (N): 8.24 meters
• Northwest (NW): 7.72 meters
However, it is worth noting that the analysis of omnidirectional wave heights yields even higher
results. The omnidirectional analysis considers the maximum heights that can be present in the
dataset. Yet, there were some anomalies observed regarding the estimated heights in the North,
North East, and North East directions, which exceeded those estimated in the omnidirectional
case. This raises doubts about the suitability of the Weibull distribution for accurately modeling
these specific directional patterns.