

Chapter II
Extreme Events
20
To facilitate the interpretation of the results obtained through the use of the Gumbel distribution,
a table has been created to summarize the set of extreme heights obtained based on the return
periods of these extreme events in the future.
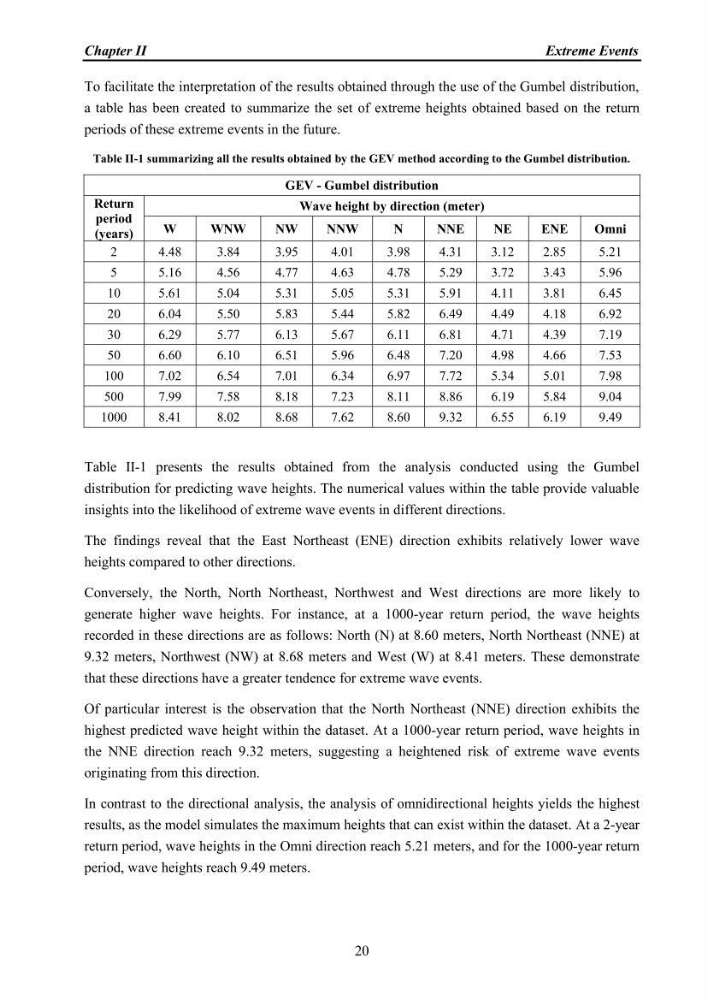
Table II-1 summarizing all the results obtained by the GEV method according to the Gumbel distribution.
GEV - Gumbel distribution
Return
period
(years)
Wave height by direction (meter)
W
WNW
NW
NNW
N
NNE
NE
ENE
Omni
2
4.48
3.84
3.95
4.01
3.98
4.31
3.12
2.85
5.21
5
5.16
4.56
4.77
4.63
4.78
5.29
3.72
3.43
5.96
10
5.61
5.04
5.31
5.05
5.31
5.91
4.11
3.81
6.45
20
6.04
5.50
5.83
5.44
5.82
6.49
4.49
4.18
6.92
30
6.29
5.77
6.13
5.67
6.11
6.81
4.71
4.39
7.19
50
6.60
6.10
6.51
5.96
6.48
7.20
4.98
4.66
7.53
100
7.02
6.54
7.01
6.34
6.97
7.72
5.34
5.01
7.98
500
7.99
7.58
8.18
7.23
8.11
8.86
6.19
5.84
9.04
1000
8.41
8.02
8.68
7.62
8.60
9.32
6.55
6.19
9.49
Table II-1 presents the results obtained from the analysis conducted using the Gumbel
distribution for predicting wave heights. The numerical values within the table provide valuable
insights into the likelihood of extreme wave events in different directions.
The findings reveal that the East Northeast (ENE) direction exhibits relatively lower wave
heights compared to other directions.
Conversely, the North, North Northeast, Northwest and West directions are more likely to
generate higher wave heights. For instance, at a 1000-year return period, the wave heights
recorded in these directions are as follows: North (N) at 8.60 meters, North Northeast (NNE) at
9.32 meters, Northwest (NW) at 8.68 meters and West (W) at 8.41 meters. These demonstrate
that these directions have a greater tendence for extreme wave events.
Of particular interest is the observation that the North Northeast (NNE) direction exhibits the
highest predicted wave height within the dataset. At a 1000-year return period, wave heights in
the NNE direction reach 9.32 meters, suggesting a heightened risk of extreme wave events
originating from this direction.
In contrast to the directional analysis, the analysis of omnidirectional heights yields the highest
results, as the model simulates the maximum heights that can exist within the dataset. At a 2-year
return period, wave heights in the Omni direction reach 5.21 meters, and for the 1000-year return
period, wave heights reach 9.49 meters.
Extreme Events
20
To facilitate the interpretation of the results obtained through the use of the Gumbel distribution,
a table has been created to summarize the set of extreme heights obtained based on the return
periods of these extreme events in the future.
Table II-1 summarizing all the results obtained by the GEV method according to the Gumbel distribution.
GEV - Gumbel distribution
Return
period
(years)
Wave height by direction (meter)
W
WNW
NW
NNW
N
NNE
NE
ENE
Omni
2
4.48
3.84
3.95
4.01
3.98
4.31
3.12
2.85
5.21
5
5.16
4.56
4.77
4.63
4.78
5.29
3.72
3.43
5.96
10
5.61
5.04
5.31
5.05
5.31
5.91
4.11
3.81
6.45
20
6.04
5.50
5.83
5.44
5.82
6.49
4.49
4.18
6.92
30
6.29
5.77
6.13
5.67
6.11
6.81
4.71
4.39
7.19
50
6.60
6.10
6.51
5.96
6.48
7.20
4.98
4.66
7.53
100
7.02
6.54
7.01
6.34
6.97
7.72
5.34
5.01
7.98
500
7.99
7.58
8.18
7.23
8.11
8.86
6.19
5.84
9.04
1000
8.41
8.02
8.68
7.62
8.60
9.32
6.55
6.19
9.49
Table II-1 presents the results obtained from the analysis conducted using the Gumbel
distribution for predicting wave heights. The numerical values within the table provide valuable
insights into the likelihood of extreme wave events in different directions.
The findings reveal that the East Northeast (ENE) direction exhibits relatively lower wave
heights compared to other directions.
Conversely, the North, North Northeast, Northwest and West directions are more likely to
generate higher wave heights. For instance, at a 1000-year return period, the wave heights
recorded in these directions are as follows: North (N) at 8.60 meters, North Northeast (NNE) at
9.32 meters, Northwest (NW) at 8.68 meters and West (W) at 8.41 meters. These demonstrate
that these directions have a greater tendence for extreme wave events.
Of particular interest is the observation that the North Northeast (NNE) direction exhibits the
highest predicted wave height within the dataset. At a 1000-year return period, wave heights in
the NNE direction reach 9.32 meters, suggesting a heightened risk of extreme wave events
originating from this direction.
In contrast to the directional analysis, the analysis of omnidirectional heights yields the highest
results, as the model simulates the maximum heights that can exist within the dataset. At a 2-year
return period, wave heights in the Omni direction reach 5.21 meters, and for the 1000-year return
period, wave heights reach 9.49 meters.