

CHAPTER IV
Results & Descussion
47
IV.1.6.4.
Urban lands
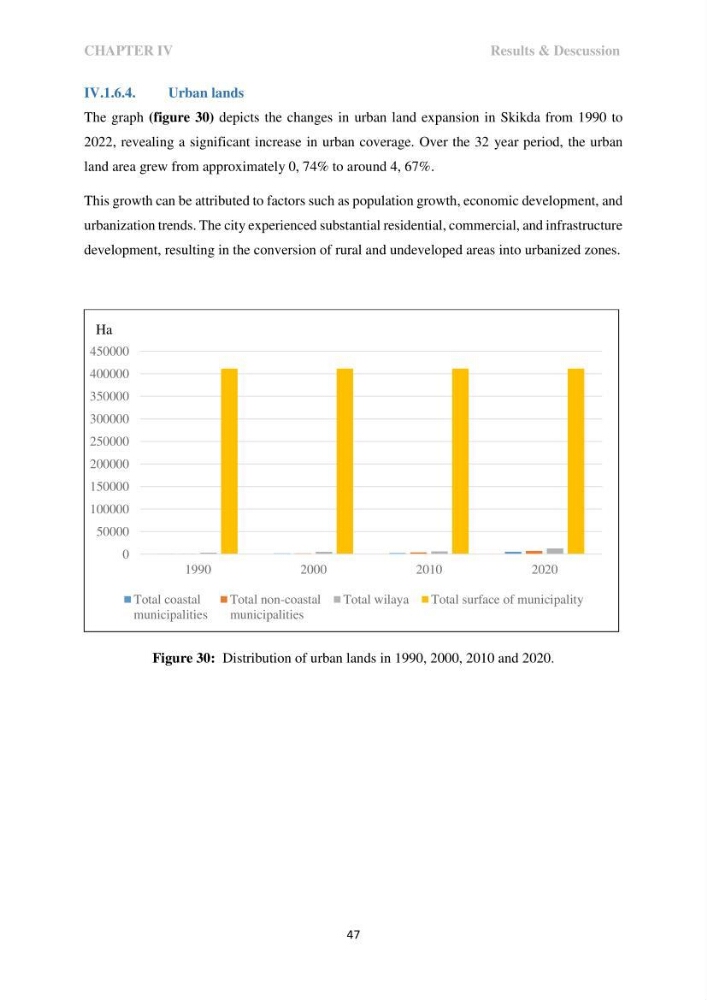
The graph (figure 30) depicts the changes in urban land expansion in Skikda from 1990 to
2022, revealing a significant increase in urban coverage. Over the 32 year period, the urban
land area grew from approximately 0, 74% to around 4, 67%.
This growth can be attributed to factors such as population growth, economic development, and
urbanization trends. The city experienced substantial residential, commercial, and infrastructure
development, resulting in the conversion of rural and undeveloped areas into urbanized zones.
Figure 30: Distribution of urban lands in 1990, 2000, 2010 and 2020.
0
50000
100000
150000
200000
250000
300000
350000
400000
450000
1990
2000
2010
2020
Total coastal
municipalities
Total non-coastal
municipalities
Total wilaya
Total surface of municipality
Ha
Results & Descussion
47
IV.1.6.4.
Urban lands
The graph (figure 30) depicts the changes in urban land expansion in Skikda from 1990 to
2022, revealing a significant increase in urban coverage. Over the 32 year period, the urban
land area grew from approximately 0, 74% to around 4, 67%.
This growth can be attributed to factors such as population growth, economic development, and
urbanization trends. The city experienced substantial residential, commercial, and infrastructure
development, resulting in the conversion of rural and undeveloped areas into urbanized zones.
Figure 30: Distribution of urban lands in 1990, 2000, 2010 and 2020.
0
50000
100000
150000
200000
250000
300000
350000
400000
450000
1990
2000
2010
2020
Total coastal
municipalities
Total non-coastal
municipalities
Total wilaya
Total surface of municipality
Ha