

95
It is noteworthy, that the shift from the bottom up model (component-based EF) to the top
down model (end-use EF) requires defining for each sector of activity (this case study) the
equivalent land use categories of the EF original model, i.e., the land types describes in the
methodological approach. For instance, the "built land" component of all sectors is aggregated
to obtain the "infrastructure" category of the original model. In contrast, the crop and grazing
land areas are disaggregated from the "Material" component to obtain the two categories
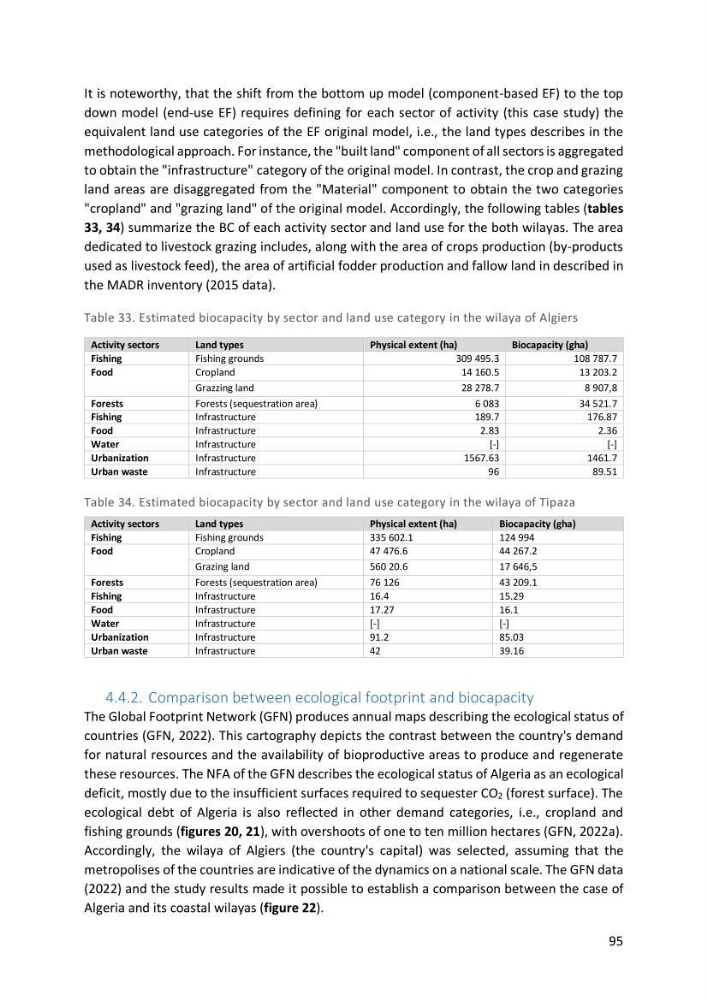
"cropland" and "grazing land" of the original model. Accordingly, the following tables (tables
33, 34) summarize the BC of each activity sector and land use for the both wilayas. The area
dedicated to livestock grazing includes, along with the area of crops production (by-products
used as livestock feed), the area of artificial fodder production and fallow land in described in
the MADR inventory (2015 data).
Table 33. Estimated biocapacity by sector and land use category in the wilaya of Algiers
Table 34. Estimated biocapacity by sector and land use category in the wilaya of Tipaza
4.4.2. Comparison between ecological footprint and biocapacity
The Global Footprint Network (GFN) produces annual maps describing the ecological status of
countries (GFN, 2022). This cartography depicts the contrast between the country's demand
for natural resources and the availability of bioproductive areas to produce and regenerate
these resources. The NFA of the GFN describes the ecological status of Algeria as an ecological
deficit, mostly due to the insufficient surfaces required to sequester CO2 (forest surface). The
ecological debt of Algeria is also reflected in other demand categories, i.e., cropland and
fishing grounds (figures 20, 21), with overshoots of one to ten million hectares (GFN, 2022a).
Accordingly, the wilaya of Algiers (the country's capital) was selected, assuming that the
metropolises of the countries are indicative of the dynamics on a national scale. The GFN data
(2022) and the study results made it possible to establish a comparison between the case of
Algeria and its coastal wilayas (figure 22).
Activity sectors
Land types
Physical extent (ha)
Biocapacity (gha)
Fishing
Fishing grounds
309 495.3
108 787.7
Food
Cropland
14 160.5
13 203.2
Grazzing land
28 278.7
8 907,8
Forests
Forests (sequestration area)
6 083
34 521.7
Fishing
Infrastructure
189.7
176.87
Food
Infrastructure
2.83
2.36
Water
Infrastructure
[-]
[-]
Urbanization
Infrastructure
1567.63
1461.7
Urban waste
Infrastructure
96
89.51
Activity sectors
Land types
Physical extent (ha)
Biocapacity (gha)
Fishing
Fishing grounds
335 602.1
124 994
Food
Cropland
47 476.6
44 267.2
Grazing land
560 20.6
17 646,5
Forests
Forests (sequestration area)
76 126
43 209.1
Fishing
Infrastructure
16.4
15.29
Food
Infrastructure
17.27
16.1
Water
Infrastructure
[-]
[-]
Urbanization
Infrastructure
91.2
85.03
Urban waste
Infrastructure
42
39.16
It is noteworthy, that the shift from the bottom up model (component-based EF) to the top
down model (end-use EF) requires defining for each sector of activity (this case study) the
equivalent land use categories of the EF original model, i.e., the land types describes in the
methodological approach. For instance, the "built land" component of all sectors is aggregated
to obtain the "infrastructure" category of the original model. In contrast, the crop and grazing
land areas are disaggregated from the "Material" component to obtain the two categories
"cropland" and "grazing land" of the original model. Accordingly, the following tables (tables
33, 34) summarize the BC of each activity sector and land use for the both wilayas. The area
dedicated to livestock grazing includes, along with the area of crops production (by-products
used as livestock feed), the area of artificial fodder production and fallow land in described in
the MADR inventory (2015 data).
Table 33. Estimated biocapacity by sector and land use category in the wilaya of Algiers
Table 34. Estimated biocapacity by sector and land use category in the wilaya of Tipaza
4.4.2. Comparison between ecological footprint and biocapacity
The Global Footprint Network (GFN) produces annual maps describing the ecological status of
countries (GFN, 2022). This cartography depicts the contrast between the country's demand
for natural resources and the availability of bioproductive areas to produce and regenerate
these resources. The NFA of the GFN describes the ecological status of Algeria as an ecological
deficit, mostly due to the insufficient surfaces required to sequester CO2 (forest surface). The
ecological debt of Algeria is also reflected in other demand categories, i.e., cropland and
fishing grounds (figures 20, 21), with overshoots of one to ten million hectares (GFN, 2022a).
Accordingly, the wilaya of Algiers (the country's capital) was selected, assuming that the
metropolises of the countries are indicative of the dynamics on a national scale. The GFN data
(2022) and the study results made it possible to establish a comparison between the case of
Algeria and its coastal wilayas (figure 22).
Activity sectors
Land types
Physical extent (ha)
Biocapacity (gha)
Fishing
Fishing grounds
309 495.3
108 787.7
Food
Cropland
14 160.5
13 203.2
Grazzing land
28 278.7
8 907,8
Forests
Forests (sequestration area)
6 083
34 521.7
Fishing
Infrastructure
189.7
176.87
Food
Infrastructure
2.83
2.36
Water
Infrastructure
[-]
[-]
Urbanization
Infrastructure
1567.63
1461.7
Urban waste
Infrastructure
96
89.51
Activity sectors
Land types
Physical extent (ha)
Biocapacity (gha)
Fishing
Fishing grounds
335 602.1
124 994
Food
Cropland
47 476.6
44 267.2
Grazing land
560 20.6
17 646,5
Forests
Forests (sequestration area)
76 126
43 209.1
Fishing
Infrastructure
16.4
15.29
Food
Infrastructure
17.27
16.1
Water
Infrastructure
[-]
[-]
Urbanization
Infrastructure
91.2
85.03
Urban waste
Infrastructure
42
39.16