

32
1.4.2.1. Yield Factor
Each country has its own set of yield factors given by bioproductive area categories. These
figures are calculated each year based on the annual availability of usable commodities
(Monfred et al., 2004; Ewing et al., 2009; Lin et al., 2016). It is the ratio between the national
average yield and the global average yield of a specific product (Monfred et al., 2004;
Wackernagel et al., 2004; Lin et al., 2016).
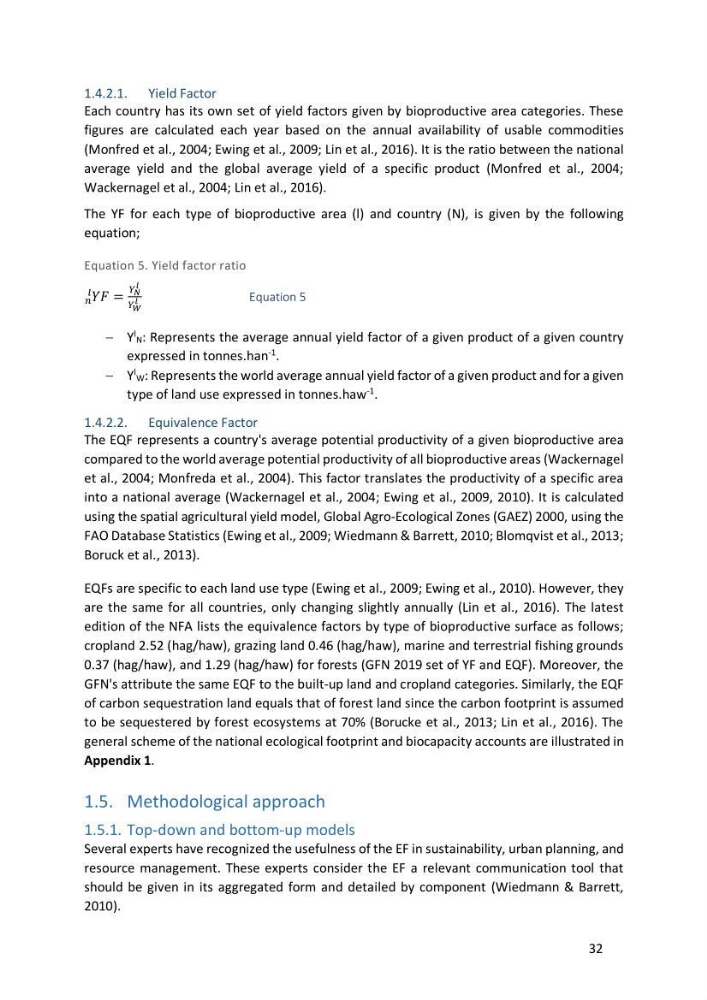
The YF for each type of bioproductive area (l) and country (N), is given by the following
equation;
Equation 5. Yield factor ratio
í µí±í µí°¹
<
C
=
; D
E
; F
E
Equation 5
- Y
l N: Represents the average annual yield factor of a given product of a given country
expressed in tonnes.han
-1
.
- Y
l W: Represents the world average annual yield factor of a given product and for a given
type of land use expressed in tonnes.haw
-1
.
1.4.2.2. Equivalence Factor
The EQF represents a country's average potential productivity of a given bioproductive area
compared to the world average potential productivity of all bioproductive areas (Wackernagel
et al., 2004; Monfreda et al., 2004). This factor translates the productivity of a specific area
into a national average (Wackernagel et al., 2004; Ewing et al., 2009, 2010). It is calculated
using the spatial agricultural yield model, Global Agro-Ecological Zones (GAEZ) 2000, using the
FAO Database Statistics (Ewing et al., 2009; Wiedmann & Barrett, 2010; Blomqvist et al., 2013;
Boruck et al., 2013).
EQFs are specific to each land use type (Ewing et al., 2009; Ewing et al., 2010). However, they
are the same for all countries, only changing slightly annually (Lin et al., 2016). The latest
edition of the NFA lists the equivalence factors by type of bioproductive surface as follows;
cropland 2.52 (hag/haw), grazing land 0.46 (hag/haw), marine and terrestrial fishing grounds
0.37 (hag/haw), and 1.29 (hag/haw) for forests (GFN 2019 set of YF and EQF). Moreover, the
GFN's attribute the same EQF to the built-up land and cropland categories. Similarly, the EQF
of carbon sequestration land equals that of forest land since the carbon footprint is assumed
to be sequestered by forest ecosystems at 70% (Borucke et al., 2013; Lin et al., 2016). The
general scheme of the national ecological footprint and biocapacity accounts are illustrated in
Appendix 1.
1.5. Methodological approach
1.5.1. Top-down and bottom-up models
Several experts have recognized the usefulness of the EF in sustainability, urban planning, and
resource management. These experts consider the EF a relevant communication tool that
should be given in its aggregated form and detailed by component (Wiedmann & Barrett,
2010).
1.4.2.1. Yield Factor
Each country has its own set of yield factors given by bioproductive area categories. These
figures are calculated each year based on the annual availability of usable commodities
(Monfred et al., 2004; Ewing et al., 2009; Lin et al., 2016). It is the ratio between the national
average yield and the global average yield of a specific product (Monfred et al., 2004;
Wackernagel et al., 2004; Lin et al., 2016).
The YF for each type of bioproductive area (l) and country (N), is given by the following
equation;
Equation 5. Yield factor ratio
í µí±í µí°¹
<
C
=
; D
E
; F
E
Equation 5
- Y
l N: Represents the average annual yield factor of a given product of a given country
expressed in tonnes.han
-1
.
- Y
l W: Represents the world average annual yield factor of a given product and for a given
type of land use expressed in tonnes.haw
-1
.
1.4.2.2. Equivalence Factor
The EQF represents a country's average potential productivity of a given bioproductive area
compared to the world average potential productivity of all bioproductive areas (Wackernagel
et al., 2004; Monfreda et al., 2004). This factor translates the productivity of a specific area
into a national average (Wackernagel et al., 2004; Ewing et al., 2009, 2010). It is calculated
using the spatial agricultural yield model, Global Agro-Ecological Zones (GAEZ) 2000, using the
FAO Database Statistics (Ewing et al., 2009; Wiedmann & Barrett, 2010; Blomqvist et al., 2013;
Boruck et al., 2013).
EQFs are specific to each land use type (Ewing et al., 2009; Ewing et al., 2010). However, they
are the same for all countries, only changing slightly annually (Lin et al., 2016). The latest
edition of the NFA lists the equivalence factors by type of bioproductive surface as follows;
cropland 2.52 (hag/haw), grazing land 0.46 (hag/haw), marine and terrestrial fishing grounds
0.37 (hag/haw), and 1.29 (hag/haw) for forests (GFN 2019 set of YF and EQF). Moreover, the
GFN's attribute the same EQF to the built-up land and cropland categories. Similarly, the EQF
of carbon sequestration land equals that of forest land since the carbon footprint is assumed
to be sequestered by forest ecosystems at 70% (Borucke et al., 2013; Lin et al., 2016). The
general scheme of the national ecological footprint and biocapacity accounts are illustrated in
Appendix 1.
1.5. Methodological approach
1.5.1. Top-down and bottom-up models
Several experts have recognized the usefulness of the EF in sustainability, urban planning, and
resource management. These experts consider the EF a relevant communication tool that
should be given in its aggregated form and detailed by component (Wiedmann & Barrett,
2010).