

27
1.3.3. Specification of the Ecological footprint
1.3.3.1. Ecological footprint and carbon footprint
It is essential to reiterate that the EF calculations only consider carbon dioxide (CO2) in terms
of the waste generated by human activities. In this case, the EF evaluates the equivalent
absorption surface required (carbon sequestration footprint), considering the sequestering
potential of forest ecosystems. By comparison, the carbon footprint is performed separately
from the ecosystems' state and capacity, corresponding to an absolute emissions
quantification or monetary value (Ewing et al., 2009; 2010). Moreover, the carbon footprint
could be regarded as a sub-component of the ecological footprint.
1.3.3.2. Ecological footprint, biocapacity and global hectares
To better assess the impact of natural resource use, the final aggregate measure of EF
associated with all uses is compared to biological capacity (BC). The GFN defines BC as the
available area to produce biological materials used by humans and to absorb the waste they
generate, taking into account prevailing management patterns and extraction technologies
(GFN, 2022b).
Although both metrics are expressed in land area (gha), it is important to distinguish between
EF, which is a hypothetical area needed for production (sequestration), and biocapacity,
derived from an existing physical productive area. Indeed, both metrics are expressed in a
standardized hectare (Uhde, 2009), the global hectare (gha), used for accurate comparison
across countries (Wiedmann & Lenzen, 2007; Ewing et al., 2009; 2010).
In addition to a physical extent, this unit accounts for variation in yield and average
productivity of productive areas obtained using a conversion coefficient (EQF) based on the
global average agricultural land productivity (Global Agro-Ecological Zones GAEZ) (FAO, 2000;
Uhde, 2009; Borucke et al., 2013, 2016; WWF, 2016; GFN, 2022b). Comparing the EF to the BC
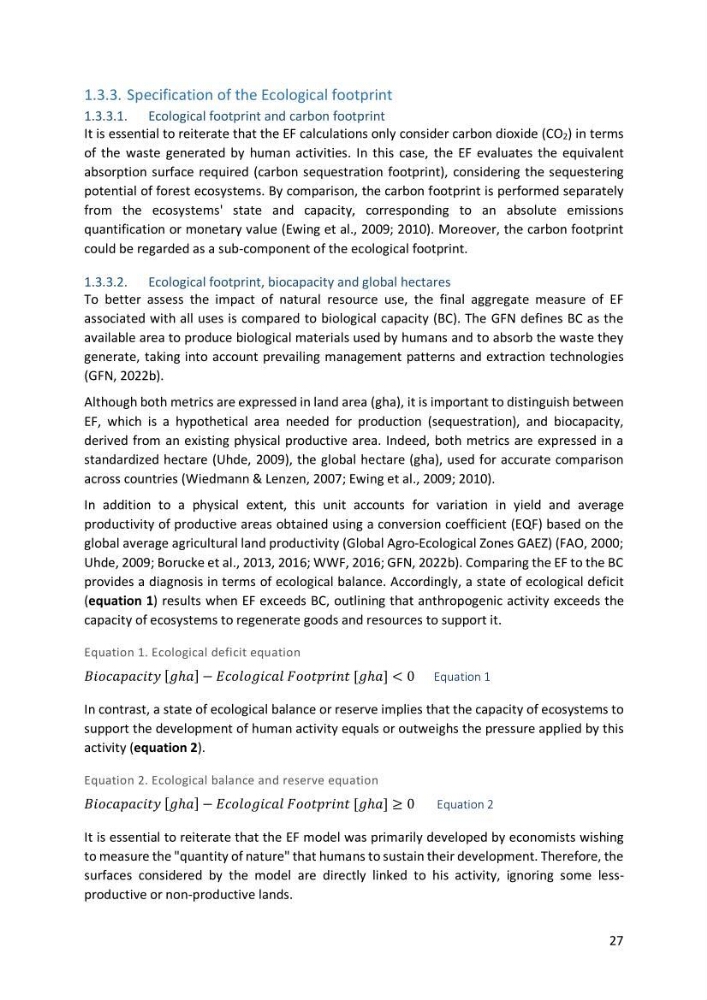
provides a diagnosis in terms of ecological balance. Accordingly, a state of ecological deficit
(equation 1) results when EF exceeds BC, outlining that anthropogenic activity exceeds the
capacity of ecosystems to regenerate goods and resources to support it.
Equation 1. Ecological deficit equation
í µí°µí µí±í µí±í µí±í µí±í µí±í µí±í µí±í µí±í µí±¡í µí±¦ [í µí±ℎí µí±] − í µí°¸í µí±í µí±í µí±í µí±í µí±í µí±í µí±í µí±í µí± í µí°¹í µí±í µí±í µí±¡í µí±í µí±í µí±í µí±í µí±¡ [í µí±ℎí µí±] < 0 Equation 1
In contrast, a state of ecological balance or reserve implies that the capacity of ecosystems to
support the development of human activity equals or outweighs the pressure applied by this
activity (equation 2).
Equation 2. Ecological balance and reserve equation
í µí°µí µí±í µí±í µí±í µí±í µí±í µí±í µí±í µí±í µí±¡í µí±¦ [í µí±ℎí µí±] − í µí°¸í µí±í µí±í µí±í µí±í µí±í µí±í µí±í µí±í µí± í µí°¹í µí±í µí±í µí±¡í µí±í µí±í µí±í µí±í µí±¡ [í µí±ℎí µí±] ≥ 0
Equation 2
It is essential to reiterate that the EF model was primarily developed by economists wishing
to measure the "quantity of nature" that humans to sustain their development. Therefore, the
surfaces considered by the model are directly linked to his activity, ignoring some lessproductive or non-productive lands.
1.3.3. Specification of the Ecological footprint
1.3.3.1. Ecological footprint and carbon footprint
It is essential to reiterate that the EF calculations only consider carbon dioxide (CO2) in terms
of the waste generated by human activities. In this case, the EF evaluates the equivalent
absorption surface required (carbon sequestration footprint), considering the sequestering
potential of forest ecosystems. By comparison, the carbon footprint is performed separately
from the ecosystems' state and capacity, corresponding to an absolute emissions
quantification or monetary value (Ewing et al., 2009; 2010). Moreover, the carbon footprint
could be regarded as a sub-component of the ecological footprint.
1.3.3.2. Ecological footprint, biocapacity and global hectares
To better assess the impact of natural resource use, the final aggregate measure of EF
associated with all uses is compared to biological capacity (BC). The GFN defines BC as the
available area to produce biological materials used by humans and to absorb the waste they
generate, taking into account prevailing management patterns and extraction technologies
(GFN, 2022b).
Although both metrics are expressed in land area (gha), it is important to distinguish between
EF, which is a hypothetical area needed for production (sequestration), and biocapacity,
derived from an existing physical productive area. Indeed, both metrics are expressed in a
standardized hectare (Uhde, 2009), the global hectare (gha), used for accurate comparison
across countries (Wiedmann & Lenzen, 2007; Ewing et al., 2009; 2010).
In addition to a physical extent, this unit accounts for variation in yield and average
productivity of productive areas obtained using a conversion coefficient (EQF) based on the
global average agricultural land productivity (Global Agro-Ecological Zones GAEZ) (FAO, 2000;
Uhde, 2009; Borucke et al., 2013, 2016; WWF, 2016; GFN, 2022b). Comparing the EF to the BC
provides a diagnosis in terms of ecological balance. Accordingly, a state of ecological deficit
(equation 1) results when EF exceeds BC, outlining that anthropogenic activity exceeds the
capacity of ecosystems to regenerate goods and resources to support it.
Equation 1. Ecological deficit equation
í µí°µí µí±í µí±í µí±í µí±í µí±í µí±í µí±í µí±í µí±¡í µí±¦ [í µí±ℎí µí±] − í µí°¸í µí±í µí±í µí±í µí±í µí±í µí±í µí±í µí±í µí± í µí°¹í µí±í µí±í µí±¡í µí±í µí±í µí±í µí±í µí±¡ [í µí±ℎí µí±] < 0 Equation 1
In contrast, a state of ecological balance or reserve implies that the capacity of ecosystems to
support the development of human activity equals or outweighs the pressure applied by this
activity (equation 2).
Equation 2. Ecological balance and reserve equation
í µí°µí µí±í µí±í µí±í µí±í µí±í µí±í µí±í µí±í µí±¡í µí±¦ [í µí±ℎí µí±] − í µí°¸í µí±í µí±í µí±í µí±í µí±í µí±í µí±í µí±í µí± í µí°¹í µí±í µí±í µí±¡í µí±í µí±í µí±í µí±í µí±¡ [í µí±ℎí µí±] ≥ 0
Equation 2
It is essential to reiterate that the EF model was primarily developed by economists wishing
to measure the "quantity of nature" that humans to sustain their development. Therefore, the
surfaces considered by the model are directly linked to his activity, ignoring some lessproductive or non-productive lands.