

Application of Probability to Mechanical Design
73
used with a factor of safety calculation. Further note (Eq. (2.54))
1
Cv = 4-0.08 for a
e
Cv = 4-0.07 for metallic yields
Cv = 4-0.05 for metallic ultimates
ke = 1 for a coupling equation calculation (Eq. (2.42)) and }~.
The values correct ae or increase the amplitude stress depending on the
calculation. If a curve is developed and line A in Fig. 2.15 is to be drawn,
some knowledge about the spread of the data about the a,t mean should
be obtained. However, if kc is only used on a~, it should be noted that a
line c is generated where the reliability is 0.99 at ~ and slips to 0.50 at
the ultimate, a,t. The curve would be more accurate ifke is applied to both
a.t and ae until material data are available.
4. Temperature, kd
In general, the endurance limit increases as temperature decreases, but
specific data should be obtained for any anticipated temperature condition
since factors other than temperature, per se, could control. For example,
for many steels the range of temperature associated with transition from
ductile to brittle behavior has to be allowed for. In addition, for some
materials, structural phase changes occur at elevated temperature that
might tend to increase the fatigue life. The low temperature kd values [2.11]
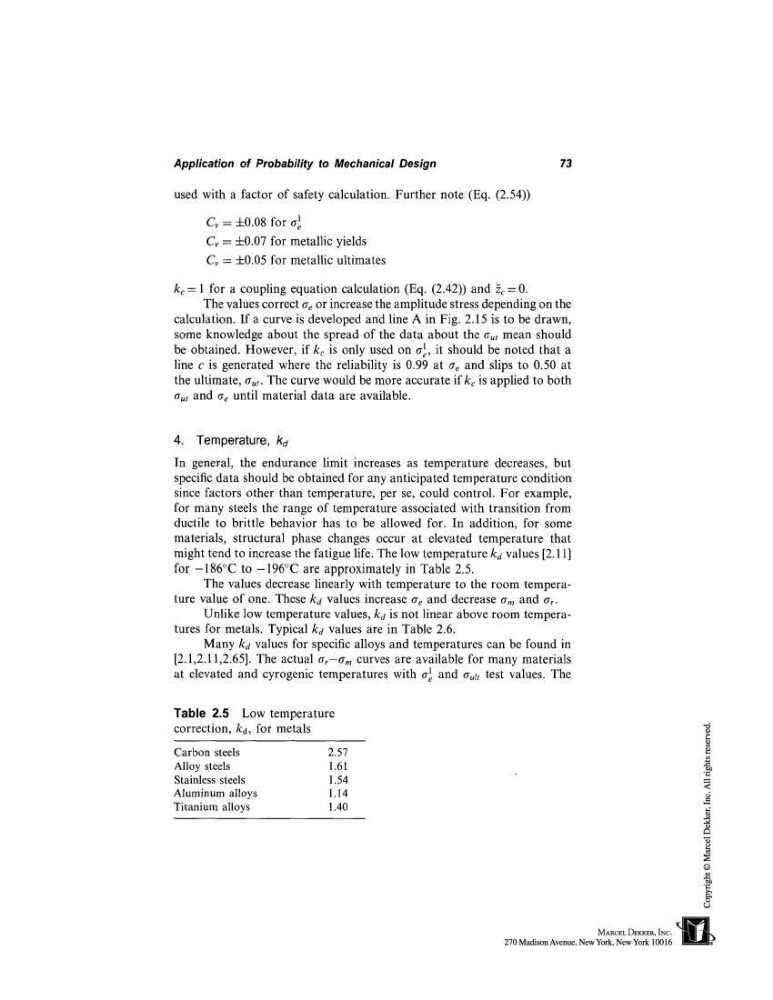
for -186°C to -196°C are approximately in Table 2.5.
The values decrease linearly with temperature to the room temperature value of one. These kd values increase ae and decrease 6 m and
Unlike low temperature values, kd is not linear above room temperatures for metals. Typical kd values are in Table 2.6.
Many kd values for specific alloys and temperatures can be found in
[2.1,2.11,2.65]. The actual at--am curves are available for many materials
1 and
test values. The
at elevated and cyrogenic temperatures with a
e
Table 2.5 Low temperature
correction,
kd, for metals
Carbon steels
Alloy steels
Stainless steels
Aluminum alloys
Titanium alloys
2.57
1.61
1.54
1.14
1.40
73
used with a factor of safety calculation. Further note (Eq. (2.54))
1
Cv = 4-0.08 for a
e
Cv = 4-0.07 for metallic yields
Cv = 4-0.05 for metallic ultimates
ke = 1 for a coupling equation calculation (Eq. (2.42)) and }~.
The values correct ae or increase the amplitude stress depending on the
calculation. If a curve is developed and line A in Fig. 2.15 is to be drawn,
some knowledge about the spread of the data about the a,t mean should
be obtained. However, if kc is only used on a~, it should be noted that a
line c is generated where the reliability is 0.99 at ~ and slips to 0.50 at
the ultimate, a,t. The curve would be more accurate ifke is applied to both
a.t and ae until material data are available.
4. Temperature, kd
In general, the endurance limit increases as temperature decreases, but
specific data should be obtained for any anticipated temperature condition
since factors other than temperature, per se, could control. For example,
for many steels the range of temperature associated with transition from
ductile to brittle behavior has to be allowed for. In addition, for some
materials, structural phase changes occur at elevated temperature that
might tend to increase the fatigue life. The low temperature kd values [2.11]
for -186°C to -196°C are approximately in Table 2.5.
The values decrease linearly with temperature to the room temperature value of one. These kd values increase ae and decrease 6 m and
Unlike low temperature values, kd is not linear above room temperatures for metals. Typical kd values are in Table 2.6.
Many kd values for specific alloys and temperatures can be found in
[2.1,2.11,2.65]. The actual at--am curves are available for many materials
1 and
test values. The
at elevated and cyrogenic temperatures with a
e
Table 2.5 Low temperature
correction,
kd, for metals
Carbon steels
Alloy steels
Stainless steels
Aluminum alloys
Titanium alloys
2.57
1.61
1.54
1.14
1.40