

Application of Probability to Mechanical Design
67
can be applied either to ~rm and a,. or ay and ~re. When stresses are complex
and ~r can be treated using combined stresses, where for plane stress the
distortion energy gives
O’m; ~ ~/~.2vm -- O’xmffym + g;,2 m
+ 3 2"cxy
m
(2.48)
’ V/~
(2.49)
ar = r -- ~xr~),r + %2r + 3Z2~yr
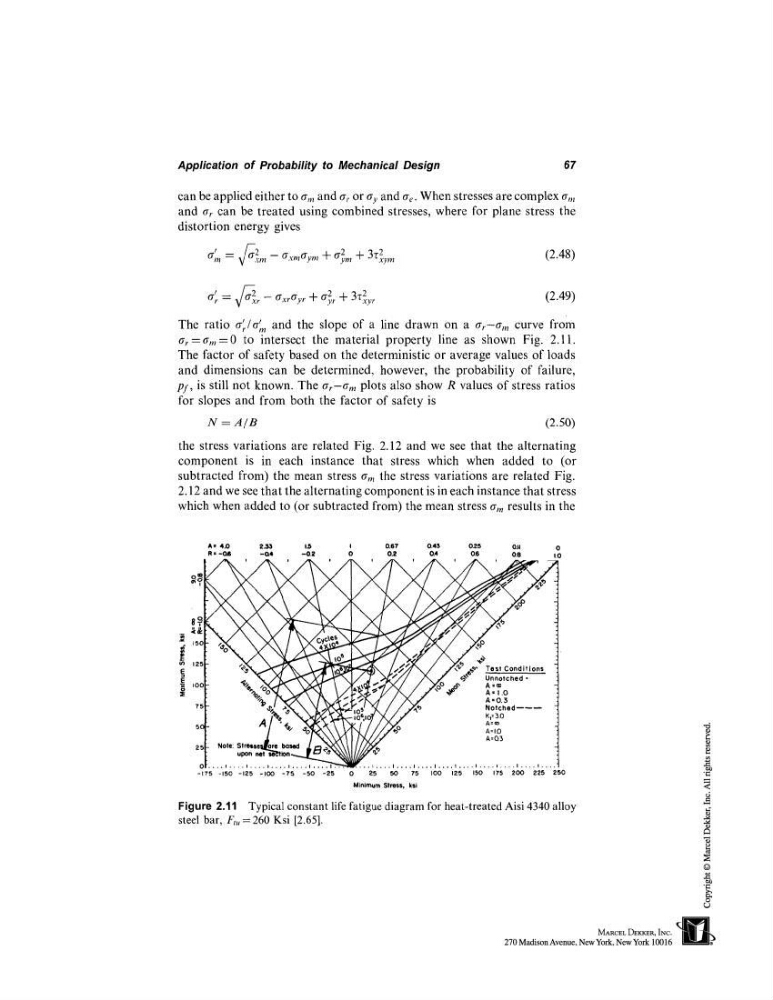
The ratio o-’r/~r~, , and the slope of a line drawn on a ~,.-am curve from
~ =~,,=0 to intersect the material property line as shown Fig. 2.11.
The factor of safety based on the deterministic or average values of loads
and dimensions can be determined, however, the probability of failure,
pf, is still not known. The ar--am plots also show R values of stress ratios
for slopes and from both the factor of safety is
N = A/B
(2.50)
the stress variations are related Fig. 2.12 and we see that the alternating
component is in each instance that stress which when added to (or
subtracted from) the mean stress a,, the stress variations are related Fig.
2.12 and we see that the alternating component is in each instance that stress
which when added to (or subtracted from) the mean stress o-m results in the
A= 4.0
233
I~,
I
0.67
0.43
025
031
0
R ¯ -OJS
-04
-0.2
O
0.2
0.4
0~
0.8
1.0
>,,/’
125
~o ’~’~Te sl Conditions
I
~.~
~i~o~
X//
~,=~.o
-~75 -150 -125 -I00 -75 -50 -25
0
~:5 50
75
I00 125 150 175 200 225 250
Minimum Stress, ksi
Figure 2.11 Typical constant life fatigue diagram for heat-treated Aisi 4340 alloy
steel bar, F~, = 260 Ksi [2.65].
67
can be applied either to ~rm and a,. or ay and ~re. When stresses are complex
and ~r can be treated using combined stresses, where for plane stress the
distortion energy gives
O’m; ~ ~/~.2vm -- O’xmffym + g;,2 m
+ 3 2"cxy
m
(2.48)
’ V/~
(2.49)
ar = r -- ~xr~),r + %2r + 3Z2~yr
The ratio o-’r/~r~, , and the slope of a line drawn on a ~,.-am curve from
~ =~,,=0 to intersect the material property line as shown Fig. 2.11.
The factor of safety based on the deterministic or average values of loads
and dimensions can be determined, however, the probability of failure,
pf, is still not known. The ar--am plots also show R values of stress ratios
for slopes and from both the factor of safety is
N = A/B
(2.50)
the stress variations are related Fig. 2.12 and we see that the alternating
component is in each instance that stress which when added to (or
subtracted from) the mean stress a,, the stress variations are related Fig.
2.12 and we see that the alternating component is in each instance that stress
which when added to (or subtracted from) the mean stress o-m results in the
A= 4.0
233
I~,
I
0.67
0.43
025
031
0
R ¯ -OJS
-04
-0.2
O
0.2
0.4
0~
0.8
1.0
>,,/’
125
~o ’~’~Te sl Conditions
I
~.~
~i~o~
X//
~,=~.o
-~75 -150 -125 -I00 -75 -50 -25
0
~:5 50
75
I00 125 150 175 200 225 250
Minimum Stress, ksi
Figure 2.11 Typical constant life fatigue diagram for heat-treated Aisi 4340 alloy
steel bar, F~, = 260 Ksi [2.65].