

Data Reduction
21
f~om
The
The
Fig. E.1 and Eq. (1.66)
~A = 43,108 4- 3.15(387)
41,889 < 7A -< 44,327 psi
SAS solution for 26 points from Eq. (1.65) yields
42,721 < y < 43,495 psi
infinite Weibull distribution Eq. (1.14)
/~ is from Eq. (170)
69 is from Eq. (172)
y is from Eq. (1.74)
(1.74)
(1.75)
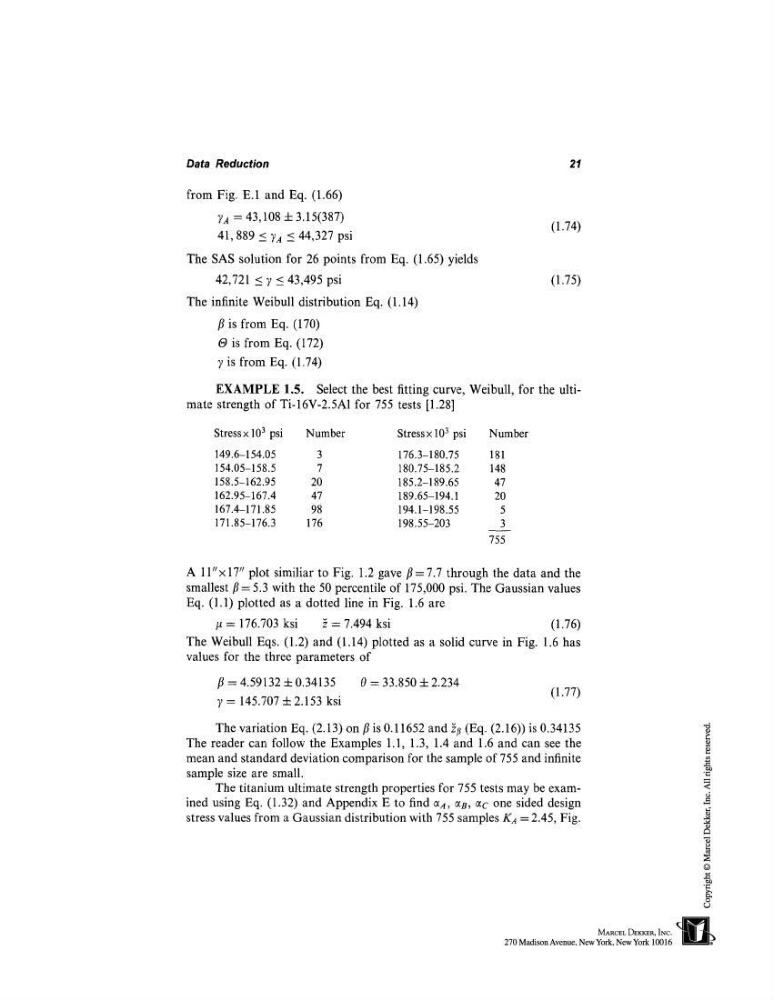
EXAMPLE 1.5. Select the best fitting curve, Weibull, for the ultimate strength of Ti-16V-2.5A1 for 755 tests [1.28]
Stress × 10 3 psi
Number
Stress × 103 psi
Number
149.6-154.05
3
176.3-180.75
181
154.05-158.5
7
180.75-185.2
148
158.5-162.95
20
185.2-189.65
47
162.95-167.4
47
189.65-194.1
20
167.4-171.85
98
194.1-198.55
5
171.85-176.3
176
198.55-203
3
755
A ll"x17" plot similiar to Fig. 1.2 gave/~=7.7 through the data and the
smallest/~ -- 5.3 with the 50 percentile of 175,000 psi. The Gaussian values
Eq. (1.1) plotted as a dotted line in Fig. 1.6 are
/~ = 176.703 ksi ~ = 7.494 ksi
(1.76)
The Weibull Eqs. (1.2) and (1.14) plotted as a solid curve in Fig. 1.6
values for the three parameters of
~ = 4.59132 4- 0.34135
0 = 33.850 4- 2.234
~ = 145.707 + 2.153 ksi
(1.77)
The variation Eq. (2.13) on//is 0.11652 and ~t~ (Eq. (2.16)) is 0.34135
The reader can follow the Examples 1.1, 1.3, 1.4 and 1.6 and can see the
mean and standard deviation comparison for the sample of 755 and infinite
sample size are small.
The titanium ultimate strength properties for 755 tests may be examined using Eq. (1.32) and Appendix E to find ~,, ee, ec one sided design
stress values from a Gaussian distribution with 755 samples KA = 2.45, Fig.
21
f~om
The
The
Fig. E.1 and Eq. (1.66)
~A = 43,108 4- 3.15(387)
41,889 < 7A -< 44,327 psi
SAS solution for 26 points from Eq. (1.65) yields
42,721 < y < 43,495 psi
infinite Weibull distribution Eq. (1.14)
/~ is from Eq. (170)
69 is from Eq. (172)
y is from Eq. (1.74)
(1.74)
(1.75)
EXAMPLE 1.5. Select the best fitting curve, Weibull, for the ultimate strength of Ti-16V-2.5A1 for 755 tests [1.28]
Stress × 10 3 psi
Number
Stress × 103 psi
Number
149.6-154.05
3
176.3-180.75
181
154.05-158.5
7
180.75-185.2
148
158.5-162.95
20
185.2-189.65
47
162.95-167.4
47
189.65-194.1
20
167.4-171.85
98
194.1-198.55
5
171.85-176.3
176
198.55-203
3
755
A ll"x17" plot similiar to Fig. 1.2 gave/~=7.7 through the data and the
smallest/~ -- 5.3 with the 50 percentile of 175,000 psi. The Gaussian values
Eq. (1.1) plotted as a dotted line in Fig. 1.6 are
/~ = 176.703 ksi ~ = 7.494 ksi
(1.76)
The Weibull Eqs. (1.2) and (1.14) plotted as a solid curve in Fig. 1.6
values for the three parameters of
~ = 4.59132 4- 0.34135
0 = 33.850 4- 2.234
~ = 145.707 + 2.153 ksi
(1.77)
The variation Eq. (2.13) on//is 0.11652 and ~t~ (Eq. (2.16)) is 0.34135
The reader can follow the Examples 1.1, 1.3, 1.4 and 1.6 and can see the
mean and standard deviation comparison for the sample of 755 and infinite
sample size are small.
The titanium ultimate strength properties for 755 tests may be examined using Eq. (1.32) and Appendix E to find ~,, ee, ec one sided design
stress values from a Gaussian distribution with 755 samples KA = 2.45, Fig.