

198
Chapter 4
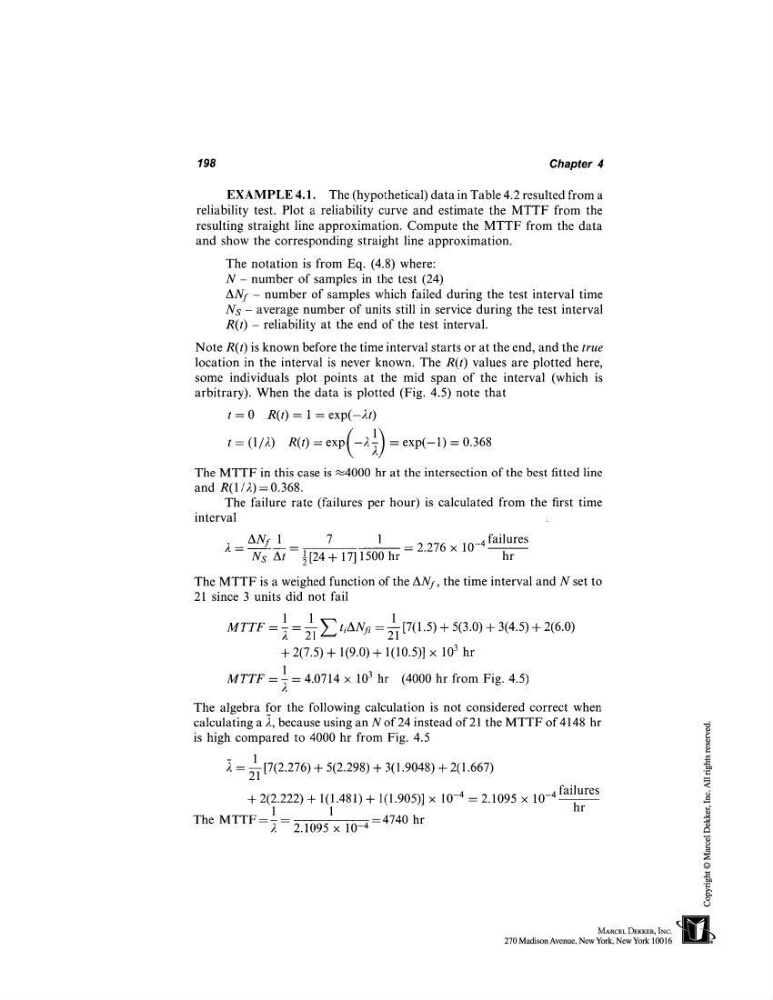
EXAMPLE 4.1. The (hypothetical) data in Table 4.2 resulted from
reliability test. Plot a reliability curve and estimate the MTTF from the
resulting straight line approximation. Compute the MTTF from the data
and show the corresponding straight line approximation.
The notation is from Eq. (4.8) where:
N- number of samples in the test (24)
AN T - number of samples which failed during the test interval time
Ns - average number of units still in service during the test interval
R(t) reliability at theend of t he test inter val.
Note R(t) is known before the time interval starts or at the end, and the true
location in the interval is never known. The R(t) values are plotted here,
some individuals plot points at the mid span of the interval (which is
arbitrary). When the data is plotted (Fig. 4.5) note that
t = 0 R(t) = 1 = exp(-2t)
t=(1/2)
R(t)=exp(-2~)=exp(-1)=0.368
The MTTF in this case is ~4000 hr at the intersection of the best fitted line
and R(1/2) = 0.368.
The failure rate (failures per hour) is calculated from the first time
interval
-
10 -4 failures
2
ANf 1
7
1
= 2.276 ×
NS At ½ [24 + 17] 1500 hr
hr
The MTTF is a weighed function of the ANy, the time interval and N set to
21 since 3 units did not fail
1 _ 211
MrrF - x ~ tizXU~,- = [7(1.5) + 5(3.0) + 3(4.5) +
+ 2(7.5) + 1(9.0) + 1(10.5)] x
1
MTTF = ~ = 4.0714 × 10³ hr (4000 hr from Fig. 4.5)
The algebra for the following calculation is not considered correct when
calculating a ~, because using an N of 24 instead of 21 the MTTF of 4148 hr
is high compared to 4000 hr from Fig. 4.5
= ~1 [7(2.276) + 5(2.298) + 3(1.9048) + 2(1.667)
+ 2(2.222) + 1(1.481) + 1(1.905)] -4 = 2.1 095 x 10 -4 failu res
1
1
hr
The
MTTF
....
4740 hr
2 2.1095 x 10
-4
Chapter 4
EXAMPLE 4.1. The (hypothetical) data in Table 4.2 resulted from
reliability test. Plot a reliability curve and estimate the MTTF from the
resulting straight line approximation. Compute the MTTF from the data
and show the corresponding straight line approximation.
The notation is from Eq. (4.8) where:
N- number of samples in the test (24)
AN T - number of samples which failed during the test interval time
Ns - average number of units still in service during the test interval
R(t) reliability at theend of t he test inter val.
Note R(t) is known before the time interval starts or at the end, and the true
location in the interval is never known. The R(t) values are plotted here,
some individuals plot points at the mid span of the interval (which is
arbitrary). When the data is plotted (Fig. 4.5) note that
t = 0 R(t) = 1 = exp(-2t)
t=(1/2)
R(t)=exp(-2~)=exp(-1)=0.368
The MTTF in this case is ~4000 hr at the intersection of the best fitted line
and R(1/2) = 0.368.
The failure rate (failures per hour) is calculated from the first time
interval
-
10 -4 failures
2
ANf 1
7
1
= 2.276 ×
NS At ½ [24 + 17] 1500 hr
hr
The MTTF is a weighed function of the ANy, the time interval and N set to
21 since 3 units did not fail
1 _ 211
MrrF - x ~ tizXU~,- = [7(1.5) + 5(3.0) + 3(4.5) +
+ 2(7.5) + 1(9.0) + 1(10.5)] x
1
MTTF = ~ = 4.0714 × 10³ hr (4000 hr from Fig. 4.5)
The algebra for the following calculation is not considered correct when
calculating a ~, because using an N of 24 instead of 21 the MTTF of 4148 hr
is high compared to 4000 hr from Fig. 4.5
= ~1 [7(2.276) + 5(2.298) + 3(1.9048) + 2(1.667)
+ 2(2.222) + 1(1.481) + 1(1.905)] -4 = 2.1 095 x 10 -4 failu res
1
1
hr
The
MTTF
....
4740 hr
2 2.1095 x 10
-4