

190
Chapter 4
t 1
Time
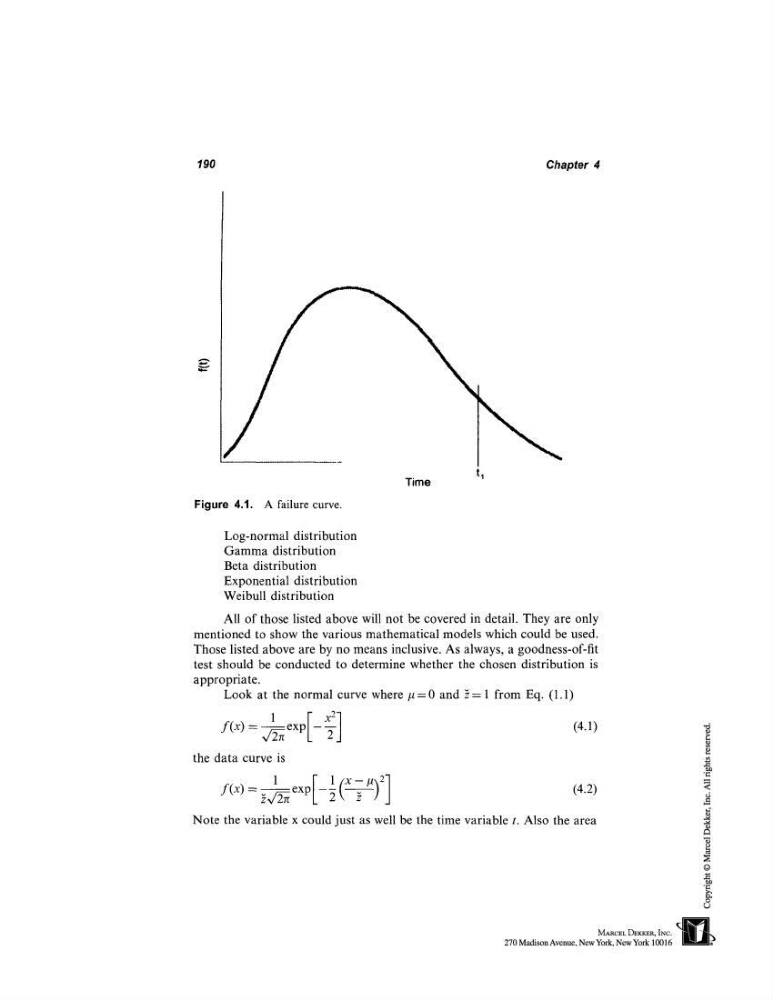
Figure 4.1. A failure curve.
Log-normal distribution
Gamma distribution
Beta distribution
Exponential distribution
Weibull distribution
All of those listed above will not be covered in detail. They are only
mentioned to show the various mathematical models which could be used.
Those listed above are by no means inclusive. As always, a goodness-of-fit
test should be conducted to determine whether the chosen distribution is
appropriate.
Look at the normal curve where ~t = 0 and ~ = 1 from Eq. (1.1)
1
[- x
2-]
f(x) ---- exp l- ~-/
(4.1)
x/2~
L
J
the data curve is
l expr-½
Note the variable x could just as well be the time variable t. Also the area
Chapter 4
t 1
Time
Figure 4.1. A failure curve.
Log-normal distribution
Gamma distribution
Beta distribution
Exponential distribution
Weibull distribution
All of those listed above will not be covered in detail. They are only
mentioned to show the various mathematical models which could be used.
Those listed above are by no means inclusive. As always, a goodness-of-fit
test should be conducted to determine whether the chosen distribution is
appropriate.
Look at the normal curve where ~t = 0 and ~ = 1 from Eq. (1.1)
1
[- x
2-]
f(x) ---- exp l- ~-/
(4.1)
x/2~
L
J
the data curve is
l expr-½
Note the variable x could just as well be the time variable t. Also the area