

Application of Probability to Mechanical Design
95
~ -3
_C
I
0.1
8
I
I
I
I
I
I
I
I
0 1
2
3
4
5
6
7
log cycles
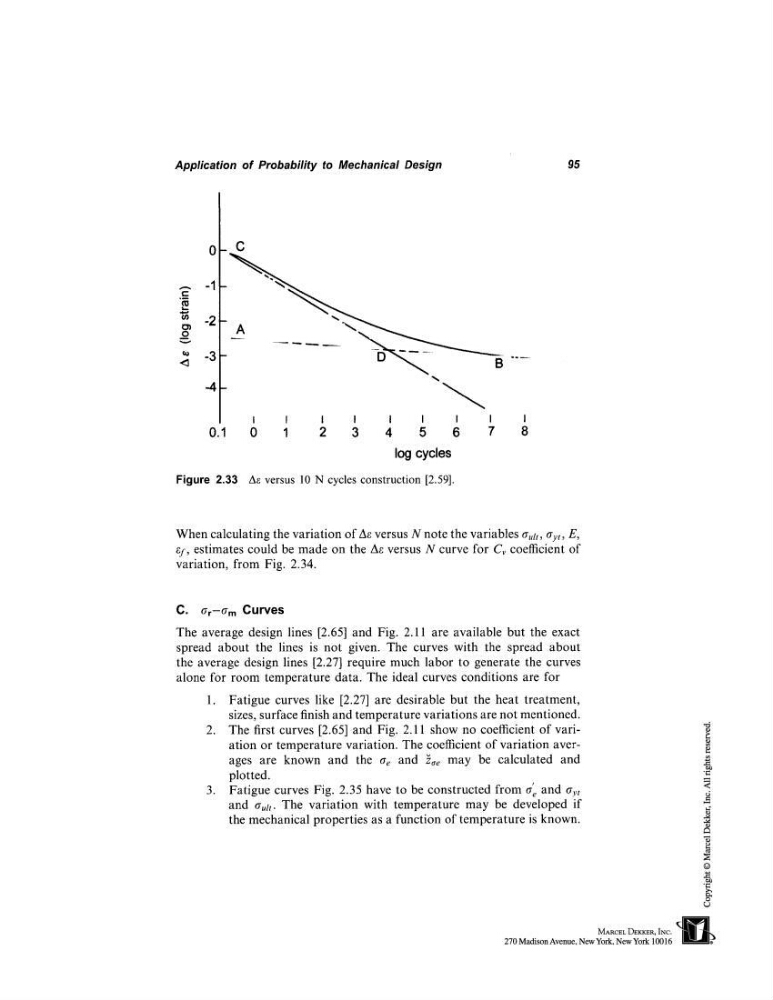
Figure 2.33 A~ versus 10 N cycles construction [2.59].
When calculating the variation of Ae versus N note the variables a,tt, ayt, E,
ef, estimates could be made on the Ae versus N curve for Cv coefficient of
variation, from Fig. 2.34.
C.
O’r -- O" m Curves
The average design lines [2.65] and Fig. 2.1l are available but the exact
spread about the lines is not given. The curves with the spread about
the average design lines [2.27] require much labor to generate the curves
alone for room temperature data. The ideal curves conditions are for
1. Fatigue curves like [2.27] are desirable but the heat treatment,
sizes, surface finish and temperature variations are not mentioned.
2. The first curves [2.65] and Fig. 2.11 show no coefficient of variation or temperature variation. The coefficient of variation averages are known and the ae and ~oe may be calculated and
plotted.
3. Fatigue curves Fig. 2.35 have to be constructed from o’e and Oyt
and a,/t. The variation with temperature may be developed if
the mechanical properties as a function of temperature is known.
95
~ -3
_C
I
0.1
8
I
I
I
I
I
I
I
I
0 1
2
3
4
5
6
7
log cycles
Figure 2.33 A~ versus 10 N cycles construction [2.59].
When calculating the variation of Ae versus N note the variables a,tt, ayt, E,
ef, estimates could be made on the Ae versus N curve for Cv coefficient of
variation, from Fig. 2.34.
C.
O’r -- O" m Curves
The average design lines [2.65] and Fig. 2.1l are available but the exact
spread about the lines is not given. The curves with the spread about
the average design lines [2.27] require much labor to generate the curves
alone for room temperature data. The ideal curves conditions are for
1. Fatigue curves like [2.27] are desirable but the heat treatment,
sizes, surface finish and temperature variations are not mentioned.
2. The first curves [2.65] and Fig. 2.11 show no coefficient of variation or temperature variation. The coefficient of variation averages are known and the ae and ~oe may be calculated and
plotted.
3. Fatigue curves Fig. 2.35 have to be constructed from o’e and Oyt
and a,/t. The variation with temperature may be developed if
the mechanical properties as a function of temperature is known.