

77
8.5
Manage Metric vs. Imperial Units
In most scientific circles, the metric system is the only one used. However, when
presenting outside of purely scientific circles to an audience which is American or
mostly American, imperial units should be considered. Find out what is expected
from any US audience to determine whether to show imperial units, metric units, or
a combination of both.
When showing numbers with both sets of units, I suggest you show the metric
ones first, and then the imperial ones in brackets, in a lighter shade of grey.
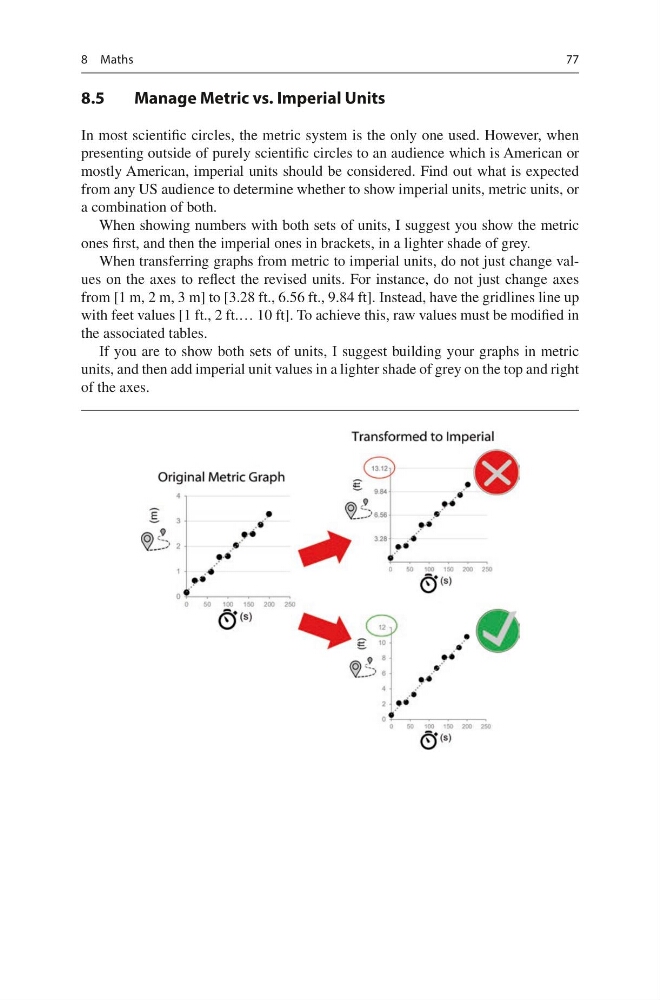
When transferring graphs from metric to imperial units, do not just change values on the axes to reflect the revised units. For instance, do not just change axes
from [1 m, 2 m, 3 m] to [3.28 ft., 6.56 ft., 9.84 ft]. Instead, have the gridlines line up
with feet values [1 ft., 2 ft.… 10 ft]. To achieve this, raw values must be modified in
the associated tables.
If you are to show both sets of units, I suggest building your graphs in metric
units, and then add imperial unit values in a lighter shade of grey on the top and right
of the axes.
8 Maths
8.5
Manage Metric vs. Imperial Units
In most scientific circles, the metric system is the only one used. However, when
presenting outside of purely scientific circles to an audience which is American or
mostly American, imperial units should be considered. Find out what is expected
from any US audience to determine whether to show imperial units, metric units, or
a combination of both.
When showing numbers with both sets of units, I suggest you show the metric
ones first, and then the imperial ones in brackets, in a lighter shade of grey.
When transferring graphs from metric to imperial units, do not just change values on the axes to reflect the revised units. For instance, do not just change axes
from [1 m, 2 m, 3 m] to [3.28 ft., 6.56 ft., 9.84 ft]. Instead, have the gridlines line up
with feet values [1 ft., 2 ft.… 10 ft]. To achieve this, raw values must be modified in
the associated tables.
If you are to show both sets of units, I suggest building your graphs in metric
units, and then add imperial unit values in a lighter shade of grey on the top and right
of the axes.
8 Maths