

69
7.4
Use Icons in Your Tables
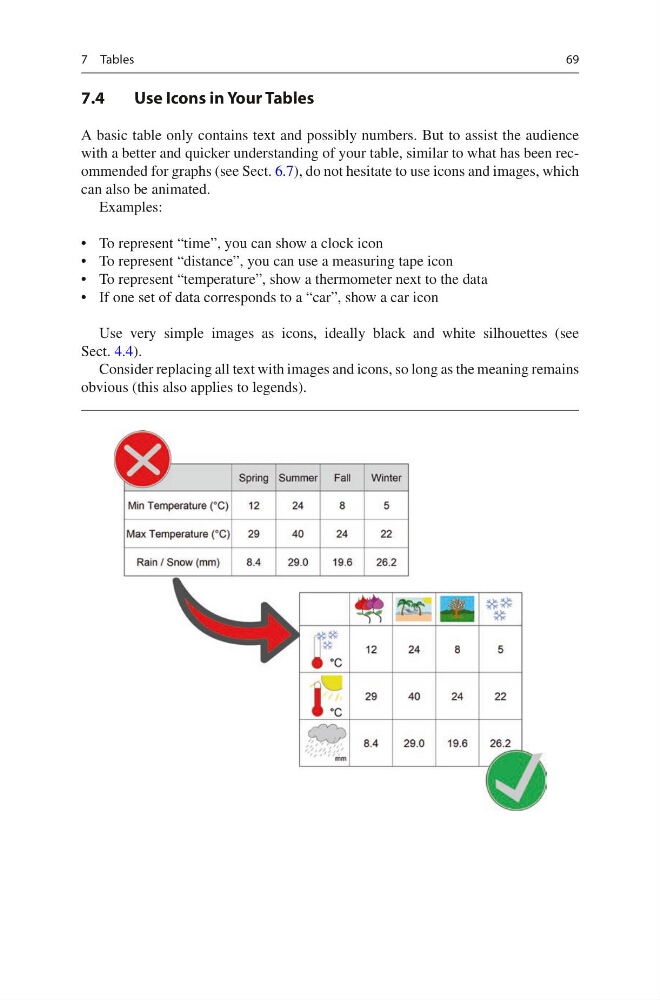
A basic table only contains text and possibly numbers. But to assist the audience
with a better and quicker understanding of your table, similar to what has been recommended for graphs (see Sect. 6.7), do not hesitate to use icons and images, which
can also be animated.
Examples:
• To represent “time”, you can show a clock icon
• To represent “distance”, you can use a measuring tape icon
• To represent “temperature”, show a thermometer next to the data
• If one set of data corresponds to a “car”, show a car icon
Use very simple images as icons, ideally black and white silhouettes (see
Sect. 4.4).
Consider replacing all text with images and icons, so long as the meaning remains
obvious (this also applies to legends).
7 Tables
7.4
Use Icons in Your Tables
A basic table only contains text and possibly numbers. But to assist the audience
with a better and quicker understanding of your table, similar to what has been recommended for graphs (see Sect. 6.7), do not hesitate to use icons and images, which
can also be animated.
Examples:
• To represent “time”, you can show a clock icon
• To represent “distance”, you can use a measuring tape icon
• To represent “temperature”, show a thermometer next to the data
• If one set of data corresponds to a “car”, show a car icon
Use very simple images as icons, ideally black and white silhouettes (see
Sect. 4.4).
Consider replacing all text with images and icons, so long as the meaning remains
obvious (this also applies to legends).
7 Tables