

47
6.2
A Graph for Each Key Finding
When delivering a presentation, you can only afford addressing a few critical findings and key concepts (despite your temptation to cover everything about your
work). Think of your summary and conclusion slides: make sure you introduce a
graph dedicated to each conclusion point, specifically and exclusively addressing
that single conclusion point.
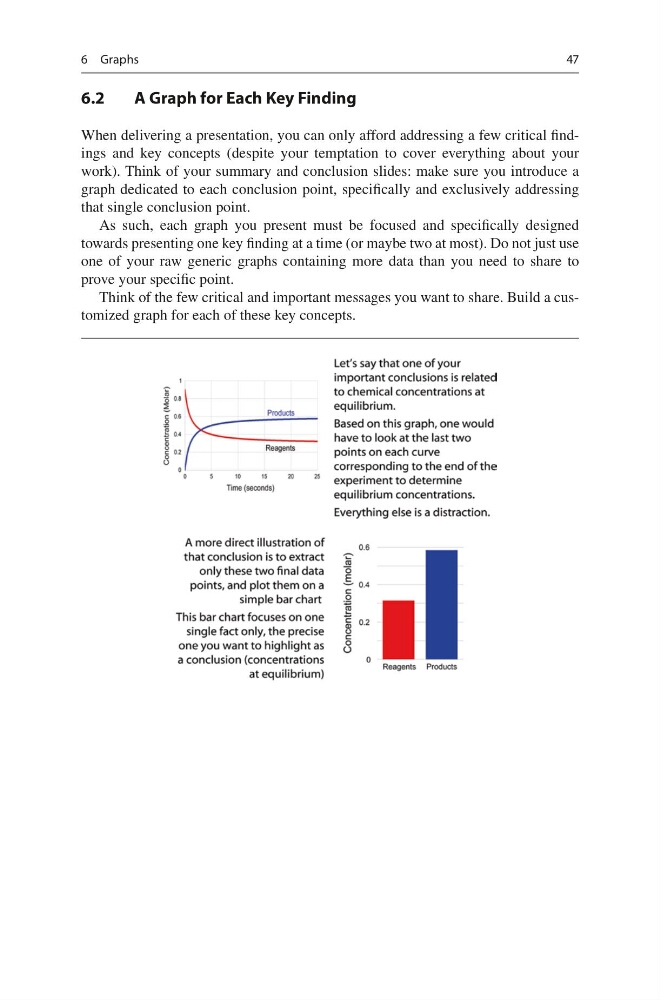
As such, each graph you present must be focused and specifically designed
towards presenting one key finding at a time (or maybe two at most). Do not just use
one of your raw generic graphs containing more data than you need to share to
prove your specific point.
Think of the few critical and important messages you want to share. Build a customized graph for each of these key concepts.
6 Graphs
6.2
A Graph for Each Key Finding
When delivering a presentation, you can only afford addressing a few critical findings and key concepts (despite your temptation to cover everything about your
work). Think of your summary and conclusion slides: make sure you introduce a
graph dedicated to each conclusion point, specifically and exclusively addressing
that single conclusion point.
As such, each graph you present must be focused and specifically designed
towards presenting one key finding at a time (or maybe two at most). Do not just use
one of your raw generic graphs containing more data than you need to share to
prove your specific point.
Think of the few critical and important messages you want to share. Build a customized graph for each of these key concepts.
6 Graphs