

50
E. van der Swaluw et al.
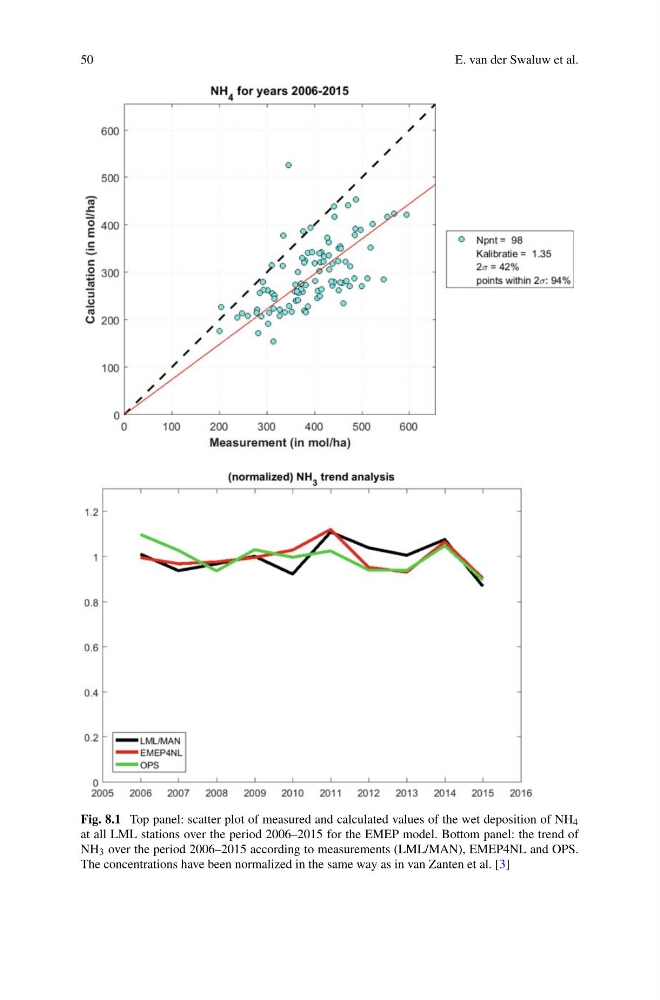
Fig. 8.1 Top panel: scatter plot of measured and calculated values of the wet deposition of NH 4
at all LML stations over the period 2006–2015 for the EMEP model. Bottom panel: the trend of
NH 3 over the period 2006–2015 according to measurements (LML/MAN), EMEP4NL and OPS.
The concentrations have been normalized in the same way as in van Zanten et al. [3]
E. van der Swaluw et al.
Fig. 8.1 Top panel: scatter plot of measured and calculated values of the wet deposition of NH 4
at all LML stations over the period 2006–2015 for the EMEP model. Bottom panel: the trend of
NH 3 over the period 2006–2015 according to measurements (LML/MAN), EMEP4NL and OPS.
The concentrations have been normalized in the same way as in van Zanten et al. [3]