

14
L. R. F. Henneman et al.
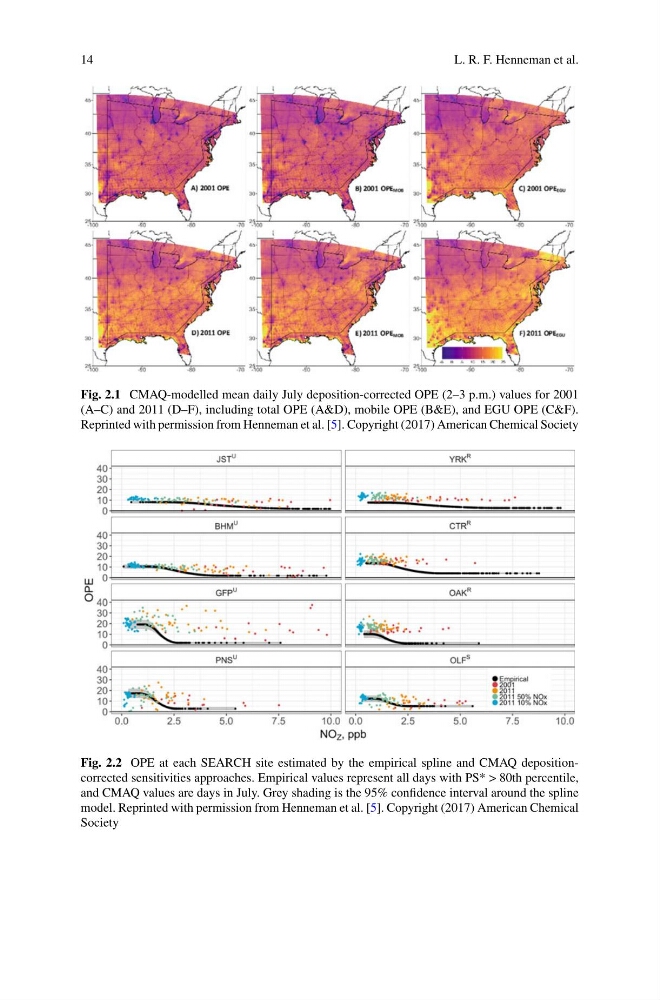
Fig. 2.1 CMAQ-modelled mean daily July deposition-corrected OPE (2–3 p.m.) values for 2001
(A–C) and 2011 (D–F), including total OPE (A&D), mobile OPE (B&E), and EGU OPE (C&F).
Reprinted with permission from Henneman et al. [5]. Copyright (2017) American Chemical Society
Fig. 2.2 OPE at each SEARCH site estimated by the empirical spline and CMAQ depositioncorrected sensitivities approaches. Empirical values represent all days with PS* > 80th percentile,
and CMAQ values are days in July. Grey shading is the 95% confidence interval around the spline
model. Reprinted with permission from Henneman et al. [5]. Copyright (2017) American Chemical
Society
L. R. F. Henneman et al.
Fig. 2.1 CMAQ-modelled mean daily July deposition-corrected OPE (2–3 p.m.) values for 2001
(A–C) and 2011 (D–F), including total OPE (A&D), mobile OPE (B&E), and EGU OPE (C&F).
Reprinted with permission from Henneman et al. [5]. Copyright (2017) American Chemical Society
Fig. 2.2 OPE at each SEARCH site estimated by the empirical spline and CMAQ depositioncorrected sensitivities approaches. Empirical values represent all days with PS* > 80th percentile,
and CMAQ values are days in July. Grey shading is the 95% confidence interval around the spline
model. Reprinted with permission from Henneman et al. [5]. Copyright (2017) American Chemical
Society