

61 Modelling Organic Aerosol in Europe …
387
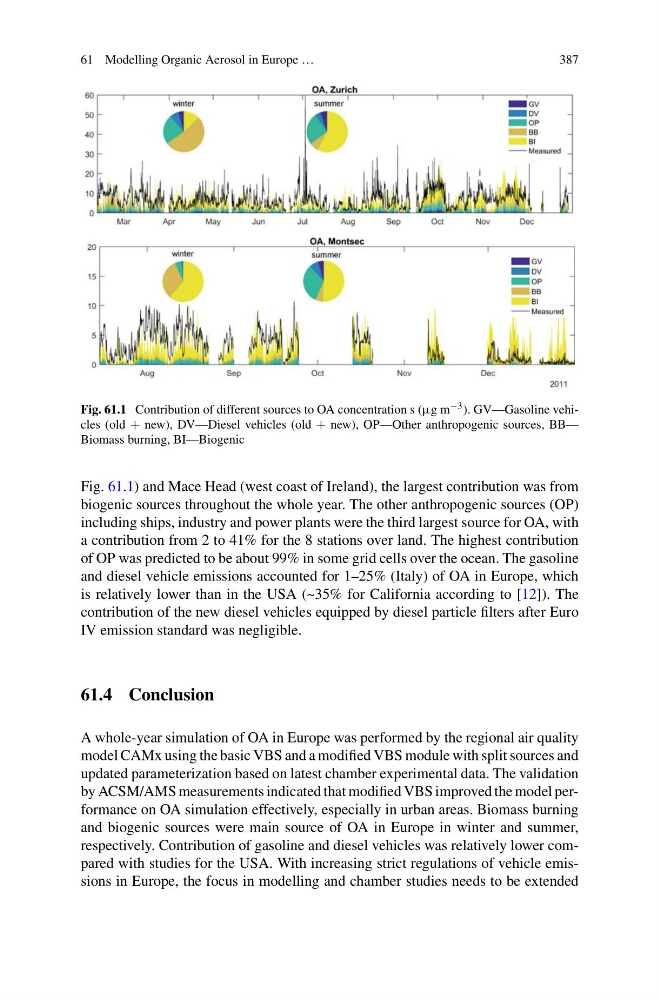
Fig. 61.1 Contribution of different sources to OA concentration s (µg m −3 ). GV—Gasoline vehicles (old + new), DV—Diesel vehicles (old + new), OP—Other anthropogenic sources, BB—
Biomass burning, BI—Biogenic
Fig. 61.1) and Mace Head (west coast of Ireland), the largest contribution was from
biogenic sources throughout the whole year. The other anthropogenic sources (OP)
including ships, industry and power plants were the third largest source for OA, with
a contribution from 2 to 41% for the 8 stations over land. The highest contribution
of OP was predicted to be about 99% in some grid cells over the ocean. The gasoline
and diesel vehicle emissions accounted for 1–25% (Italy) of OA in Europe, which
is relatively lower than in the USA (~35% for California according to [12]). The
contribution of the new diesel vehicles equipped by diesel particle filters after Euro
IV emission standard was negligible.
61.4 Conclusion
A whole-year simulation of OA in Europe was performed by the regional air quality
model CAMx using the basic VBS and a modified VBS module with split sources and
updated parameterization based on latest chamber experimental data. The validation
by ACSM/AMS measurements indicated that modified VBS improved the model performance on OA simulation effectively, especially in urban areas. Biomass burning
and biogenic sources were main source of OA in Europe in winter and summer,
respectively. Contribution of gasoline and diesel vehicles was relatively lower compared with studies for the USA. With increasing strict regulations of vehicle emissions in Europe, the focus in modelling and chamber studies needs to be extended
387
Fig. 61.1 Contribution of different sources to OA concentration s (µg m −3 ). GV—Gasoline vehicles (old + new), DV—Diesel vehicles (old + new), OP—Other anthropogenic sources, BB—
Biomass burning, BI—Biogenic
Fig. 61.1) and Mace Head (west coast of Ireland), the largest contribution was from
biogenic sources throughout the whole year. The other anthropogenic sources (OP)
including ships, industry and power plants were the third largest source for OA, with
a contribution from 2 to 41% for the 8 stations over land. The highest contribution
of OP was predicted to be about 99% in some grid cells over the ocean. The gasoline
and diesel vehicle emissions accounted for 1–25% (Italy) of OA in Europe, which
is relatively lower than in the USA (~35% for California according to [12]). The
contribution of the new diesel vehicles equipped by diesel particle filters after Euro
IV emission standard was negligible.
61.4 Conclusion
A whole-year simulation of OA in Europe was performed by the regional air quality
model CAMx using the basic VBS and a modified VBS module with split sources and
updated parameterization based on latest chamber experimental data. The validation
by ACSM/AMS measurements indicated that modified VBS improved the model performance on OA simulation effectively, especially in urban areas. Biomass burning
and biogenic sources were main source of OA in Europe in winter and summer,
respectively. Contribution of gasoline and diesel vehicles was relatively lower compared with studies for the USA. With increasing strict regulations of vehicle emissions in Europe, the focus in modelling and chamber studies needs to be extended