

364
H. Chaloupecká et al.
emergency services need to know how the situation after the leakage can look like
in mean as well as in extreme cases.
One of the crucial information for emergency services is the time when a gas cloud
gets into individual places affected by the incident. Chaloupecká et al. [2] compared
arrival times as found by different definitions and proposed a new method applicable
also in the operative stage. Lübcke et al. [5] found out that the mean value of arrival
time increases with the increasing distance from the gas source but this increase
seems to be higher close to the source. Chaloupecká et al. [1] discussed the mean
arrival time in an urban canopy in which flow was parallel with a street. Within this
parallel street, the mean value of arrival time increases linearly with the increasing
distance from the source. But a range of values of an arrival time ensemble at each
measurement position is very wide and therefore a change of values of different
quantiles at individual sampling positions is also an important aspect. Hence, we
propose a new model describing an evolution of probability density functions of
arrival time in an idealized urban canopy.
58.2 Methods and Experimental Set-up
The experiments were conducted in a wind tunnel with a neutrally stratified boundary
layer. Its characteristics agreed with the recommendations of VDI [7] for flows found
in towns (see [2] for more details). Into the tunnel, a model of an idealized urban
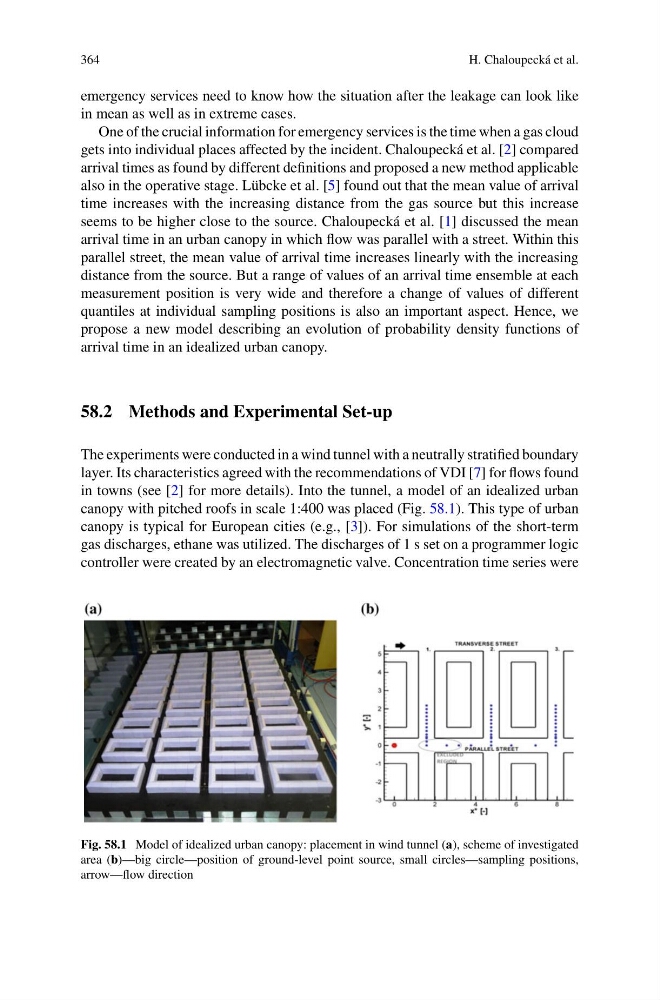
canopy with pitched roofs in scale 1:400 was placed (Fig. 58.1). This type of urban
canopy is typical for European cities (e.g., [3]). For simulations of the short-term
gas discharges, ethane was utilized. The discharges of 1 s set on a programmer logic
controller were created by an electromagnetic valve. Concentration time series were
Fig. 58.1 Model of idealized urban canopy: placement in wind tunnel (a), scheme of investigated
area (b)—big circle—position of ground-level point source, small circles—sampling positions,
arrow—flow direction
H. Chaloupecká et al.
emergency services need to know how the situation after the leakage can look like
in mean as well as in extreme cases.
One of the crucial information for emergency services is the time when a gas cloud
gets into individual places affected by the incident. Chaloupecká et al. [2] compared
arrival times as found by different definitions and proposed a new method applicable
also in the operative stage. Lübcke et al. [5] found out that the mean value of arrival
time increases with the increasing distance from the gas source but this increase
seems to be higher close to the source. Chaloupecká et al. [1] discussed the mean
arrival time in an urban canopy in which flow was parallel with a street. Within this
parallel street, the mean value of arrival time increases linearly with the increasing
distance from the source. But a range of values of an arrival time ensemble at each
measurement position is very wide and therefore a change of values of different
quantiles at individual sampling positions is also an important aspect. Hence, we
propose a new model describing an evolution of probability density functions of
arrival time in an idealized urban canopy.
58.2 Methods and Experimental Set-up
The experiments were conducted in a wind tunnel with a neutrally stratified boundary
layer. Its characteristics agreed with the recommendations of VDI [7] for flows found
in towns (see [2] for more details). Into the tunnel, a model of an idealized urban
canopy with pitched roofs in scale 1:400 was placed (Fig. 58.1). This type of urban
canopy is typical for European cities (e.g., [3]). For simulations of the short-term
gas discharges, ethane was utilized. The discharges of 1 s set on a programmer logic
controller were created by an electromagnetic valve. Concentration time series were
Fig. 58.1 Model of idealized urban canopy: placement in wind tunnel (a), scheme of investigated
area (b)—big circle—position of ground-level point source, small circles—sampling positions,
arrow—flow direction