

306
C. Hogrefe et al.
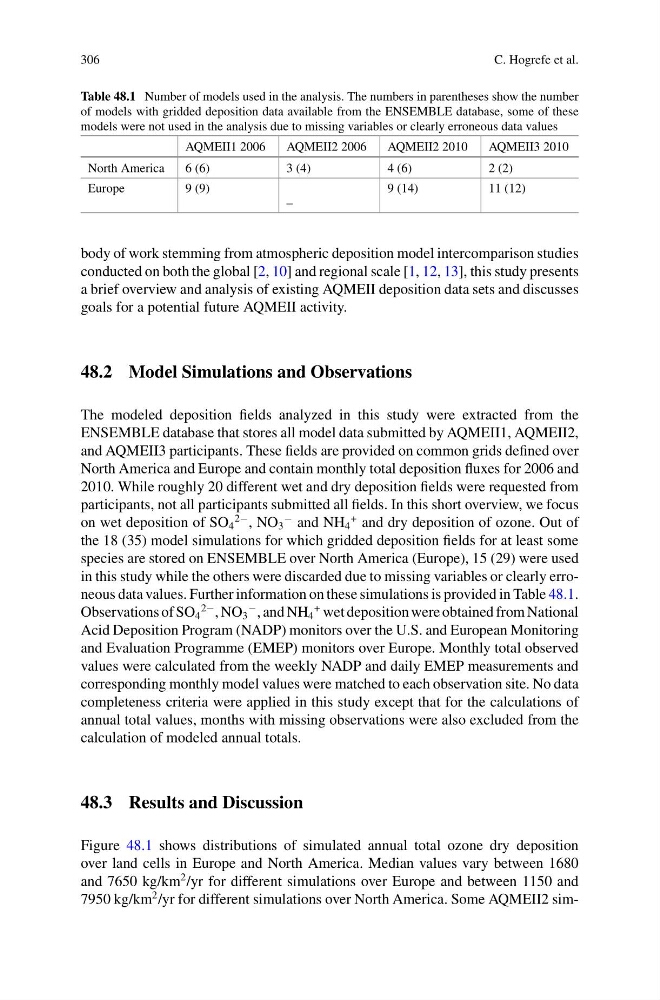
Table 48.1 Number of models used in the analysis. The numbers in parentheses show the number
of models with gridded deposition data available from the ENSEMBLE database, some of these
models were not used in the analysis due to missing variables or clearly erroneous data values
AQMEII1 2006
AQMEII2 2006
AQMEII2 2010
AQMEII3 2010
North America
6 (6)
3 (4)
4 (6)
2 (2)
Europe
9 (9)
–
9 (14)
11 (12)
body of work stemming from atmospheric deposition model intercomparison studies
conducted on both the global [2, 10] and regional scale [1, 12, 13], this study presents
a brief overview and analysis of existing AQMEII deposition data sets and discusses
goals for a potential future AQMEII activity.
48.2 Model Simulations and Observations
The modeled deposition fields analyzed in this study were extracted from the
ENSEMBLE database that stores all model data submitted by AQMEII1, AQMEII2,
and AQMEII3 participants. These fields are provided on common grids defined over
North America and Europe and contain monthly total deposition fluxes for 2006 and
2010. While roughly 20 different wet and dry deposition fields were requested from
participants, not all participants submitted all fields. In this short overview, we focus
on wet deposition of SO 4
2− , NO 3
− and NH 4
+ and dry deposition of ozone. Out of
the 18 (35) model simulations for which gridded deposition fields for at least some
species are stored on ENSEMBLE over North America (Europe), 15 (29) were used
in this study while the others were discarded due to missing variables or clearly erroneous data values. Further information on these simulations is provided in Table 48.1.
Observations of SO 4
2− , NO 3
− , and NH 4
+ wet deposition were obtained from National
Acid Deposition Program (NADP) monitors over the U.S. and European Monitoring
and Evaluation Programme (EMEP) monitors over Europe. Monthly total observed
values were calculated from the weekly NADP and daily EMEP measurements and
corresponding monthly model values were matched to each observation site. No data
completeness criteria were applied in this study except that for the calculations of
annual total values, months with missing observations were also excluded from the
calculation of modeled annual totals.
48.3 Results and Discussion
Figure 48.1 shows distributions of simulated annual total ozone dry deposition
over land cells in Europe and North America. Median values vary between 1680
and 7650 kg/km
2 /yr for different simulations over Europe and between 1150 and
7950 kg/km
2 /yr for different simulations over North America. Some AQMEII2 sim-
C. Hogrefe et al.
Table 48.1 Number of models used in the analysis. The numbers in parentheses show the number
of models with gridded deposition data available from the ENSEMBLE database, some of these
models were not used in the analysis due to missing variables or clearly erroneous data values
AQMEII1 2006
AQMEII2 2006
AQMEII2 2010
AQMEII3 2010
North America
6 (6)
3 (4)
4 (6)
2 (2)
Europe
9 (9)
–
9 (14)
11 (12)
body of work stemming from atmospheric deposition model intercomparison studies
conducted on both the global [2, 10] and regional scale [1, 12, 13], this study presents
a brief overview and analysis of existing AQMEII deposition data sets and discusses
goals for a potential future AQMEII activity.
48.2 Model Simulations and Observations
The modeled deposition fields analyzed in this study were extracted from the
ENSEMBLE database that stores all model data submitted by AQMEII1, AQMEII2,
and AQMEII3 participants. These fields are provided on common grids defined over
North America and Europe and contain monthly total deposition fluxes for 2006 and
2010. While roughly 20 different wet and dry deposition fields were requested from
participants, not all participants submitted all fields. In this short overview, we focus
on wet deposition of SO 4
2− , NO 3
− and NH 4
+ and dry deposition of ozone. Out of
the 18 (35) model simulations for which gridded deposition fields for at least some
species are stored on ENSEMBLE over North America (Europe), 15 (29) were used
in this study while the others were discarded due to missing variables or clearly erroneous data values. Further information on these simulations is provided in Table 48.1.
Observations of SO 4
2− , NO 3
− , and NH 4
+ wet deposition were obtained from National
Acid Deposition Program (NADP) monitors over the U.S. and European Monitoring
and Evaluation Programme (EMEP) monitors over Europe. Monthly total observed
values were calculated from the weekly NADP and daily EMEP measurements and
corresponding monthly model values were matched to each observation site. No data
completeness criteria were applied in this study except that for the calculations of
annual total values, months with missing observations were also excluded from the
calculation of modeled annual totals.
48.3 Results and Discussion
Figure 48.1 shows distributions of simulated annual total ozone dry deposition
over land cells in Europe and North America. Median values vary between 1680
and 7650 kg/km
2 /yr for different simulations over Europe and between 1150 and
7950 kg/km
2 /yr for different simulations over North America. Some AQMEII2 sim-