

294
S. Antonopoulos et al.
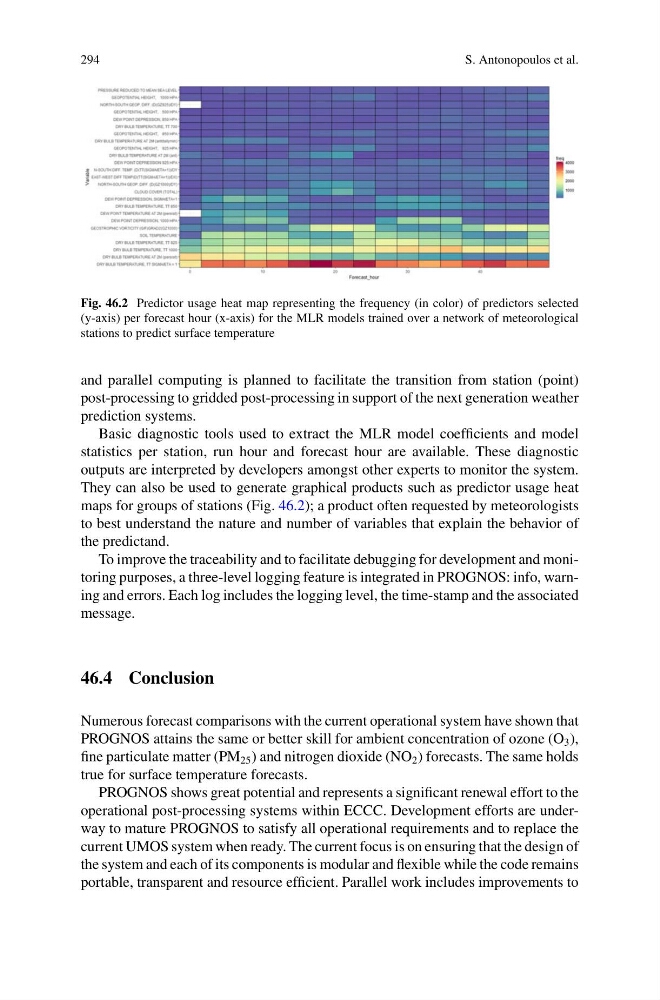
Fig. 46.2 Predictor usage heat map representing the frequency (in color) of predictors selected
(y-axis) per forecast hour (x-axis) for the MLR models trained over a network of meteorological
stations to predict surface temperature
and parallel computing is planned to facilitate the transition from station (point)
post-processing to gridded post-processing in support of the next generation weather
prediction systems.
Basic diagnostic tools used to extract the MLR model coefficients and model
statistics per station, run hour and forecast hour are available. These diagnostic
outputs are interpreted by developers amongst other experts to monitor the system.
They can also be used to generate graphical products such as predictor usage heat
maps for groups of stations (Fig. 46.2); a product often requested by meteorologists
to best understand the nature and number of variables that explain the behavior of
the predictand.
To improve the traceability and to facilitate debugging for development and monitoring purposes, a three-level logging feature is integrated in PROGNOS: info, warning and errors. Each log includes the logging level, the time-stamp and the associated
message.
46.4 Conclusion
Numerous forecast comparisons with the current operational system have shown that
PROGNOS attains the same or better skill for ambient concentration of ozone (O 3 ),
fine particulate matter (PM 25 ) and nitrogen dioxide (NO 2 ) forecasts. The same holds
true for surface temperature forecasts.
PROGNOS shows great potential and represents a significant renewal effort to the
operational post-processing systems within ECCC. Development efforts are underway to mature PROGNOS to satisfy all operational requirements and to replace the
current UMOS system when ready. The current focus is on ensuring that the design of
the system and each of its components is modular and flexible while the code remains
portable, transparent and resource efficient. Parallel work includes improvements to
S. Antonopoulos et al.
Fig. 46.2 Predictor usage heat map representing the frequency (in color) of predictors selected
(y-axis) per forecast hour (x-axis) for the MLR models trained over a network of meteorological
stations to predict surface temperature
and parallel computing is planned to facilitate the transition from station (point)
post-processing to gridded post-processing in support of the next generation weather
prediction systems.
Basic diagnostic tools used to extract the MLR model coefficients and model
statistics per station, run hour and forecast hour are available. These diagnostic
outputs are interpreted by developers amongst other experts to monitor the system.
They can also be used to generate graphical products such as predictor usage heat
maps for groups of stations (Fig. 46.2); a product often requested by meteorologists
to best understand the nature and number of variables that explain the behavior of
the predictand.
To improve the traceability and to facilitate debugging for development and monitoring purposes, a three-level logging feature is integrated in PROGNOS: info, warning and errors. Each log includes the logging level, the time-stamp and the associated
message.
46.4 Conclusion
Numerous forecast comparisons with the current operational system have shown that
PROGNOS attains the same or better skill for ambient concentration of ozone (O 3 ),
fine particulate matter (PM 25 ) and nitrogen dioxide (NO 2 ) forecasts. The same holds
true for surface temperature forecasts.
PROGNOS shows great potential and represents a significant renewal effort to the
operational post-processing systems within ECCC. Development efforts are underway to mature PROGNOS to satisfy all operational requirements and to replace the
current UMOS system when ready. The current focus is on ensuring that the design of
the system and each of its components is modular and flexible while the code remains
portable, transparent and resource efficient. Parallel work includes improvements to