

280
P. Kishcha et al.
44.1 Introduction
Taiwan is an island located at approximately 200 km eastward from the Pacific coast
of South East Asia. Both remote air pollution from highly polluted south-east Asia
(including emissions of bio-mass burning) and local air pollution from Taiwanese
industries and transportation contribute to the distribution of aerosol optical depth
(AOD) over the Taiwan area. Distinguishing between remote and local air pollutants is important for raising awareness about their separate effects on regional air
quality, weather and climate. To this end, an approach has been developed, based on
the homogeneity of both AOD data from NASA MERRA-2 aerosol reanalysis and
AERONET AOD measurements [2].
44.2 Method
According to Kishcha et al. [2], AOD and its standard deviation can be used as a
measure of air pollution homogeneity. To estimate month to month changes in air pollution homogeneity over Taiwan, we used AOD monthly data from six AERONET
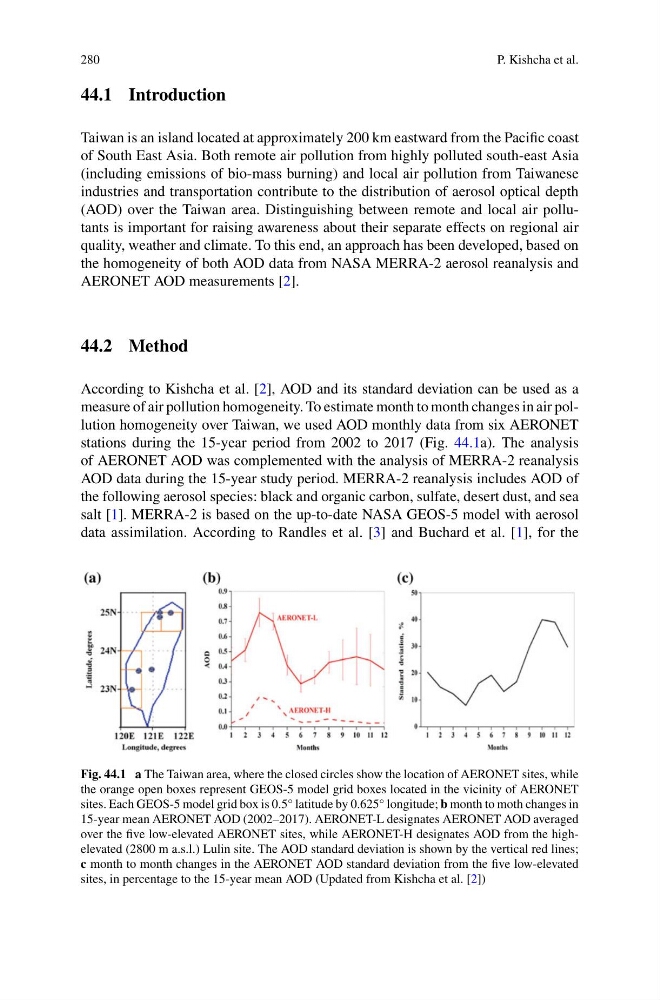
stations during the 15-year period from 2002 to 2017 (Fig. 44.1a). The analysis
of AERONET AOD was complemented with the analysis of MERRA-2 reanalysis
AOD data during the 15-year study period. MERRA-2 reanalysis includes AOD of
the following aerosol species: black and organic carbon, sulfate, desert dust, and sea
salt [1]. MERRA-2 is based on the up-to-date NASA GEOS-5 model with aerosol
data assimilation. According to Randles et al. [3] and Buchard et al. [1], for the
Fig. 44.1 a The Taiwan area, where the closed circles show the location of AERONET sites, while
the orange open boxes represent GEOS-5 model grid boxes located in the vicinity of AERONET
sites. Each GEOS-5 model grid box is 0.5° latitude by 0.625° longitude; b month to moth changes in
15-year mean AERONET AOD (2002–2017). AERONET-L designates AERONET AOD averaged
over the five low-elevated AERONET sites, while AERONET-H designates AOD from the highelevated (2800 m a.s.l.) Lulin site. The AOD standard deviation is shown by the vertical red lines;
c month to month changes in the AERONET AOD standard deviation from the five low-elevated
sites, in percentage to the 15-year mean AOD (Updated from Kishcha et al. [2])
P. Kishcha et al.
44.1 Introduction
Taiwan is an island located at approximately 200 km eastward from the Pacific coast
of South East Asia. Both remote air pollution from highly polluted south-east Asia
(including emissions of bio-mass burning) and local air pollution from Taiwanese
industries and transportation contribute to the distribution of aerosol optical depth
(AOD) over the Taiwan area. Distinguishing between remote and local air pollutants is important for raising awareness about their separate effects on regional air
quality, weather and climate. To this end, an approach has been developed, based on
the homogeneity of both AOD data from NASA MERRA-2 aerosol reanalysis and
AERONET AOD measurements [2].
44.2 Method
According to Kishcha et al. [2], AOD and its standard deviation can be used as a
measure of air pollution homogeneity. To estimate month to month changes in air pollution homogeneity over Taiwan, we used AOD monthly data from six AERONET
stations during the 15-year period from 2002 to 2017 (Fig. 44.1a). The analysis
of AERONET AOD was complemented with the analysis of MERRA-2 reanalysis
AOD data during the 15-year study period. MERRA-2 reanalysis includes AOD of
the following aerosol species: black and organic carbon, sulfate, desert dust, and sea
salt [1]. MERRA-2 is based on the up-to-date NASA GEOS-5 model with aerosol
data assimilation. According to Randles et al. [3] and Buchard et al. [1], for the
Fig. 44.1 a The Taiwan area, where the closed circles show the location of AERONET sites, while
the orange open boxes represent GEOS-5 model grid boxes located in the vicinity of AERONET
sites. Each GEOS-5 model grid box is 0.5° latitude by 0.625° longitude; b month to moth changes in
15-year mean AERONET AOD (2002–2017). AERONET-L designates AERONET AOD averaged
over the five low-elevated AERONET sites, while AERONET-H designates AOD from the highelevated (2800 m a.s.l.) Lulin site. The AOD standard deviation is shown by the vertical red lines;
c month to month changes in the AERONET AOD standard deviation from the five low-elevated
sites, in percentage to the 15-year mean AOD (Updated from Kishcha et al. [2])