

34 Global CO Emission Estimates Inferred …
221
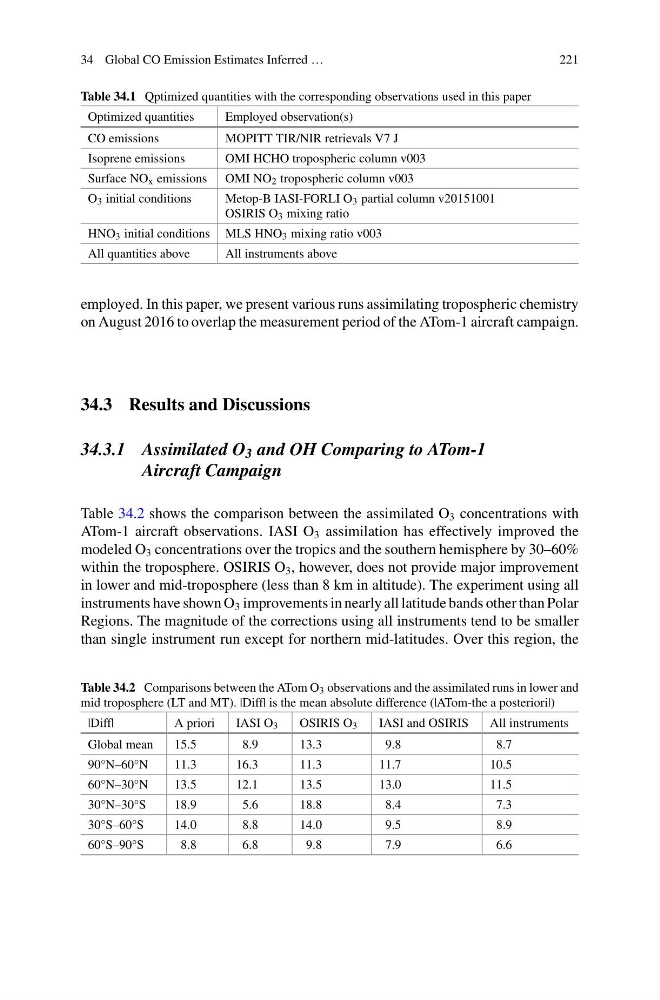
Table 34.1 Qptimized quantities with the corresponding observations used in this paper
Optimized quantities
Employed observation(s)
CO emissions
MOPITT TIR/NIR retrievals V7 J
Isoprene emissions
OMI HCHO tropospheric column v003
Surface NO x emissions OMI NO 2 tropospheric column v003
O 3 initial conditions
Metop-B IASI-FORLI O 3 partial column v20151001
OSIRIS O 3 mixing ratio
HNO 3 initial conditions MLS HNO 3 mixing ratio v003
All quantities above
All instruments above
employed. In this paper, we present various runs assimilating tropospheric chemistry
on August 2016 to overlap the measurement period of the ATom-1 aircraft campaign.
34.3 Results and Discussions
34.3.1 Assimilated O 3 and OH Comparing to ATom-1
Aircraft Campaign
Table 34.2 shows the comparison between the assimilated O 3 concentrations with
ATom-1 aircraft observations. IASI O 3 assimilation has effectively improved the
modeled O 3 concentrations over the tropics and the southern hemisphere by 30–60%
within the troposphere. OSIRIS O 3 , however, does not provide major improvement
in lower and mid-troposphere (less than 8 km in altitude). The experiment using all
instruments have shown O 3 improvements in nearly all latitude bands other than Polar
Regions. The magnitude of the corrections using all instruments tend to be smaller
than single instrument run except for northern mid-latitudes. Over this region, the
Table 34.2 Comparisons between the ATom O 3 observations and the assimilated runs in lower and
mid troposphere (LT and MT). |Diff| is the mean absolute difference (|ATom-the a posteriori|)
|Diff|
A priori
IASI O 3
OSIRIS O 3
IASI and OSIRIS
All instruments
Global mean
15.5
8.9
13.3
9.8
8.7
90°N–60°N
11.3
16.3
11.3
11.7
10.5
60°N–30°N
13.5
12.1
13.5
13.0
11.5
30°N–30°S
18.9
5.6
18.8
8.4
7.3
30°S–60°S
14.0
8.8
14.0
9.5
8.9
60°S–90°S
8.8
6.8
9.8
7.9
6.6
221
Table 34.1 Qptimized quantities with the corresponding observations used in this paper
Optimized quantities
Employed observation(s)
CO emissions
MOPITT TIR/NIR retrievals V7 J
Isoprene emissions
OMI HCHO tropospheric column v003
Surface NO x emissions OMI NO 2 tropospheric column v003
O 3 initial conditions
Metop-B IASI-FORLI O 3 partial column v20151001
OSIRIS O 3 mixing ratio
HNO 3 initial conditions MLS HNO 3 mixing ratio v003
All quantities above
All instruments above
employed. In this paper, we present various runs assimilating tropospheric chemistry
on August 2016 to overlap the measurement period of the ATom-1 aircraft campaign.
34.3 Results and Discussions
34.3.1 Assimilated O 3 and OH Comparing to ATom-1
Aircraft Campaign
Table 34.2 shows the comparison between the assimilated O 3 concentrations with
ATom-1 aircraft observations. IASI O 3 assimilation has effectively improved the
modeled O 3 concentrations over the tropics and the southern hemisphere by 30–60%
within the troposphere. OSIRIS O 3 , however, does not provide major improvement
in lower and mid-troposphere (less than 8 km in altitude). The experiment using all
instruments have shown O 3 improvements in nearly all latitude bands other than Polar
Regions. The magnitude of the corrections using all instruments tend to be smaller
than single instrument run except for northern mid-latitudes. Over this region, the
Table 34.2 Comparisons between the ATom O 3 observations and the assimilated runs in lower and
mid troposphere (LT and MT). |Diff| is the mean absolute difference (|ATom-the a posteriori|)
|Diff|
A priori
IASI O 3
OSIRIS O 3
IASI and OSIRIS
All instruments
Global mean
15.5
8.9
13.3
9.8
8.7
90°N–60°N
11.3
16.3
11.3
11.7
10.5
60°N–30°N
13.5
12.1
13.5
13.0
11.5
30°N–30°S
18.9
5.6
18.8
8.4
7.3
30°S–60°S
14.0
8.8
14.0
9.5
8.9
60°S–90°S
8.8
6.8
9.8
7.9
6.6