

214
K. Kupiainen et al.
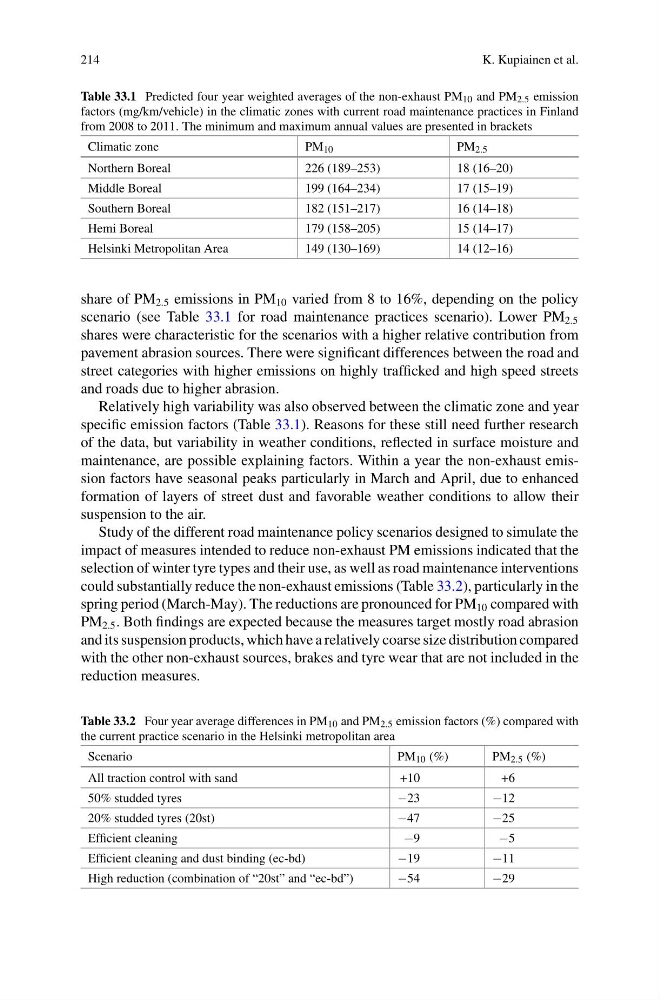
Table 33.1 Predicted four year weighted averages of the non-exhaust PM 10 and PM 2.5 emission
factors (mg/km/vehicle) in the climatic zones with current road maintenance practices in Finland
from 2008 to 2011. The minimum and maximum annual values are presented in brackets
Climatic zone
PM 10
PM 2.5
Northern Boreal
226 (189–253)
18 (16–20)
Middle Boreal
199 (164–234)
17 (15–19)
Southern Boreal
182 (151–217)
16 (14–18)
Hemi Boreal
179 (158–205)
15 (14–17)
Helsinki Metropolitan Area
149 (130–169)
14 (12–16)
share of PM 2.5 emissions in PM 10 varied from 8 to 16%, depending on the policy
scenario (see Table 33.1 for road maintenance practices scenario). Lower PM 2.5
shares were characteristic for the scenarios with a higher relative contribution from
pavement abrasion sources. There were significant differences between the road and
street categories with higher emissions on highly trafficked and high speed streets
and roads due to higher abrasion.
Relatively high variability was also observed between the climatic zone and year
specific emission factors (Table 33.1). Reasons for these still need further research
of the data, but variability in weather conditions, reflected in surface moisture and
maintenance, are possible explaining factors. Within a year the non-exhaust emission factors have seasonal peaks particularly in March and April, due to enhanced
formation of layers of street dust and favorable weather conditions to allow their
suspension to the air.
Study of the different road maintenance policy scenarios designed to simulate the
impact of measures intended to reduce non-exhaust PM emissions indicated that the
selection of winter tyre types and their use, as well as road maintenance interventions
could substantially reduce the non-exhaust emissions (Table 33.2), particularly in the
spring period (March-May). The reductions are pronounced for PM 10 compared with
PM 2.5 . Both findings are expected because the measures target mostly road abrasion
and its suspension products, which have a relatively coarse size distribution compared
with the other non-exhaust sources, brakes and tyre wear that are not included in the
reduction measures.
Table 33.2 Four year average differences in PM 10 and PM 2.5 emission factors (%) compared with
the current practice scenario in the Helsinki metropolitan area
Scenario
PM 10 (%)
PM 2.5 (%)
All traction control with sand
+10
+6
50% studded tyres
−23
−12
20% studded tyres (20st)
−47
−25
Efficient cleaning
−9
−5
Efficient cleaning and dust binding (ec-bd)
−19
−11
High reduction (combination of “20st” and “ec-bd”)
−54
−29
K. Kupiainen et al.
Table 33.1 Predicted four year weighted averages of the non-exhaust PM 10 and PM 2.5 emission
factors (mg/km/vehicle) in the climatic zones with current road maintenance practices in Finland
from 2008 to 2011. The minimum and maximum annual values are presented in brackets
Climatic zone
PM 10
PM 2.5
Northern Boreal
226 (189–253)
18 (16–20)
Middle Boreal
199 (164–234)
17 (15–19)
Southern Boreal
182 (151–217)
16 (14–18)
Hemi Boreal
179 (158–205)
15 (14–17)
Helsinki Metropolitan Area
149 (130–169)
14 (12–16)
share of PM 2.5 emissions in PM 10 varied from 8 to 16%, depending on the policy
scenario (see Table 33.1 for road maintenance practices scenario). Lower PM 2.5
shares were characteristic for the scenarios with a higher relative contribution from
pavement abrasion sources. There were significant differences between the road and
street categories with higher emissions on highly trafficked and high speed streets
and roads due to higher abrasion.
Relatively high variability was also observed between the climatic zone and year
specific emission factors (Table 33.1). Reasons for these still need further research
of the data, but variability in weather conditions, reflected in surface moisture and
maintenance, are possible explaining factors. Within a year the non-exhaust emission factors have seasonal peaks particularly in March and April, due to enhanced
formation of layers of street dust and favorable weather conditions to allow their
suspension to the air.
Study of the different road maintenance policy scenarios designed to simulate the
impact of measures intended to reduce non-exhaust PM emissions indicated that the
selection of winter tyre types and their use, as well as road maintenance interventions
could substantially reduce the non-exhaust emissions (Table 33.2), particularly in the
spring period (March-May). The reductions are pronounced for PM 10 compared with
PM 2.5 . Both findings are expected because the measures target mostly road abrasion
and its suspension products, which have a relatively coarse size distribution compared
with the other non-exhaust sources, brakes and tyre wear that are not included in the
reduction measures.
Table 33.2 Four year average differences in PM 10 and PM 2.5 emission factors (%) compared with
the current practice scenario in the Helsinki metropolitan area
Scenario
PM 10 (%)
PM 2.5 (%)
All traction control with sand
+10
+6
50% studded tyres
−23
−12
20% studded tyres (20st)
−47
−25
Efficient cleaning
−9
−5
Efficient cleaning and dust binding (ec-bd)
−19
−11
High reduction (combination of “20st” and “ec-bd”)
−54
−29