

24 Impact of Urban Land Use and Anthropogenic Heat on Air …
155
Building Height
Fraction of Buildings
Ratio H/W
Urban Roughness Length
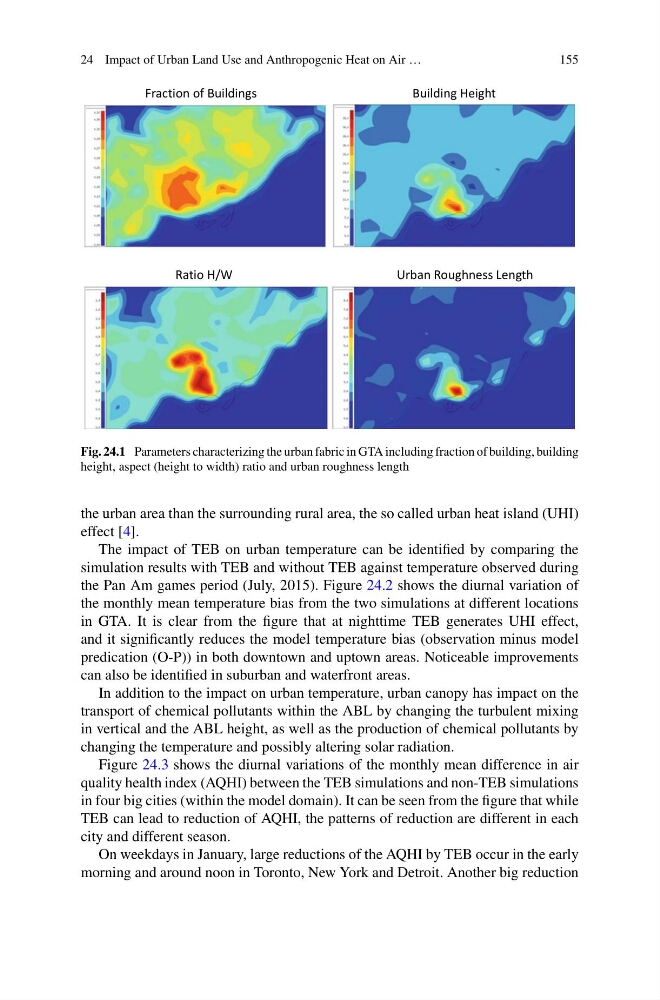
Fig. 24.1 Parameters characterizing the urban fabric in GTA including fraction of building, building
height, aspect (height to width) ratio and urban roughness length
the urban area than the surrounding rural area, the so called urban heat island (UHI)
effect [4].
The impact of TEB on urban temperature can be identified by comparing the
simulation results with TEB and without TEB against temperature observed during
the Pan Am games period (July, 2015). Figure 24.2 shows the diurnal variation of
the monthly mean temperature bias from the two simulations at different locations
in GTA. It is clear from the figure that at nighttime TEB generates UHI effect,
and it significantly reduces the model temperature bias (observation minus model
predication (O-P)) in both downtown and uptown areas. Noticeable improvements
can also be identified in suburban and waterfront areas.
In addition to the impact on urban temperature, urban canopy has impact on the
transport of chemical pollutants within the ABL by changing the turbulent mixing
in vertical and the ABL height, as well as the production of chemical pollutants by
changing the temperature and possibly altering solar radiation.
Figure 24.3 shows the diurnal variations of the monthly mean difference in air
quality health index (AQHI) between the TEB simulations and non-TEB simulations
in four big cities (within the model domain). It can be seen from the figure that while
TEB can lead to reduction of AQHI, the patterns of reduction are different in each
city and different season.
On weekdays in January, large reductions of the AQHI by TEB occur in the early
morning and around noon in Toronto, New York and Detroit. Another big reduction
155
Building Height
Fraction of Buildings
Ratio H/W
Urban Roughness Length
Fig. 24.1 Parameters characterizing the urban fabric in GTA including fraction of building, building
height, aspect (height to width) ratio and urban roughness length
the urban area than the surrounding rural area, the so called urban heat island (UHI)
effect [4].
The impact of TEB on urban temperature can be identified by comparing the
simulation results with TEB and without TEB against temperature observed during
the Pan Am games period (July, 2015). Figure 24.2 shows the diurnal variation of
the monthly mean temperature bias from the two simulations at different locations
in GTA. It is clear from the figure that at nighttime TEB generates UHI effect,
and it significantly reduces the model temperature bias (observation minus model
predication (O-P)) in both downtown and uptown areas. Noticeable improvements
can also be identified in suburban and waterfront areas.
In addition to the impact on urban temperature, urban canopy has impact on the
transport of chemical pollutants within the ABL by changing the turbulent mixing
in vertical and the ABL height, as well as the production of chemical pollutants by
changing the temperature and possibly altering solar radiation.
Figure 24.3 shows the diurnal variations of the monthly mean difference in air
quality health index (AQHI) between the TEB simulations and non-TEB simulations
in four big cities (within the model domain). It can be seen from the figure that while
TEB can lead to reduction of AQHI, the patterns of reduction are different in each
city and different season.
On weekdays in January, large reductions of the AQHI by TEB occur in the early
morning and around noon in Toronto, New York and Detroit. Another big reduction