

142
W. Lefebvre et al.
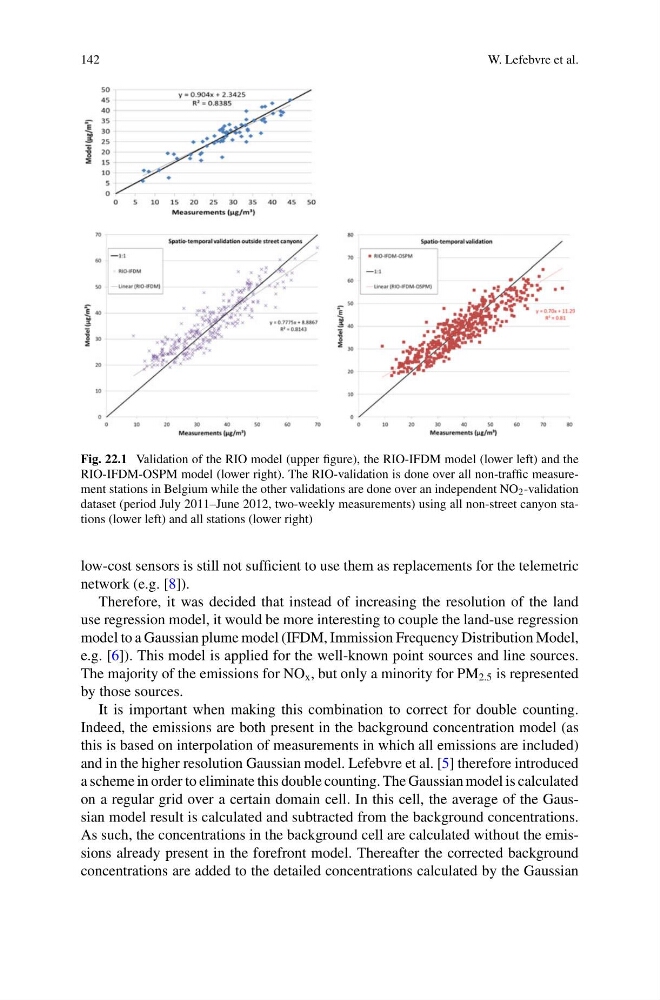
Fig. 22.1 Validation of the RIO model (upper figure), the RIO-IFDM model (lower left) and the
RIO-IFDM-OSPM model (lower right). The RIO-validation is done over all non-traffic measurement stations in Belgium while the other validations are done over an independent NO 2 -validation
dataset (period July 2011–June 2012, two-weekly measurements) using all non-street canyon stations (lower left) and all stations (lower right)
low-cost sensors is still not sufficient to use them as replacements for the telemetric
network (e.g. [8]).
Therefore, it was decided that instead of increasing the resolution of the land
use regression model, it would be more interesting to couple the land-use regression
model to a Gaussian plume model (IFDM, Immission Frequency Distribution Model,
e.g. [6]). This model is applied for the well-known point sources and line sources.
The majority of the emissions for NO x , but only a minority for PM 2.5 is represented
by those sources.
It is important when making this combination to correct for double counting.
Indeed, the emissions are both present in the background concentration model (as
this is based on interpolation of measurements in which all emissions are included)
and in the higher resolution Gaussian model. Lefebvre et al. [5] therefore introduced
a scheme in order to eliminate this double counting. The Gaussian model is calculated
on a regular grid over a certain domain cell. In this cell, the average of the Gaussian model result is calculated and subtracted from the background concentrations.
As such, the concentrations in the background cell are calculated without the emissions already present in the forefront model. Thereafter the corrected background
concentrations are added to the detailed concentrations calculated by the Gaussian
W. Lefebvre et al.
Fig. 22.1 Validation of the RIO model (upper figure), the RIO-IFDM model (lower left) and the
RIO-IFDM-OSPM model (lower right). The RIO-validation is done over all non-traffic measurement stations in Belgium while the other validations are done over an independent NO 2 -validation
dataset (period July 2011–June 2012, two-weekly measurements) using all non-street canyon stations (lower left) and all stations (lower right)
low-cost sensors is still not sufficient to use them as replacements for the telemetric
network (e.g. [8]).
Therefore, it was decided that instead of increasing the resolution of the land
use regression model, it would be more interesting to couple the land-use regression
model to a Gaussian plume model (IFDM, Immission Frequency Distribution Model,
e.g. [6]). This model is applied for the well-known point sources and line sources.
The majority of the emissions for NO x , but only a minority for PM 2.5 is represented
by those sources.
It is important when making this combination to correct for double counting.
Indeed, the emissions are both present in the background concentration model (as
this is based on interpolation of measurements in which all emissions are included)
and in the higher resolution Gaussian model. Lefebvre et al. [5] therefore introduced
a scheme in order to eliminate this double counting. The Gaussian model is calculated
on a regular grid over a certain domain cell. In this cell, the average of the Gaussian model result is calculated and subtracted from the background concentrations.
As such, the concentrations in the background cell are calculated without the emissions already present in the forefront model. Thereafter the corrected background
concentrations are added to the detailed concentrations calculated by the Gaussian