

21 Atmospheric Pollution: Experience from Mexico City …
131
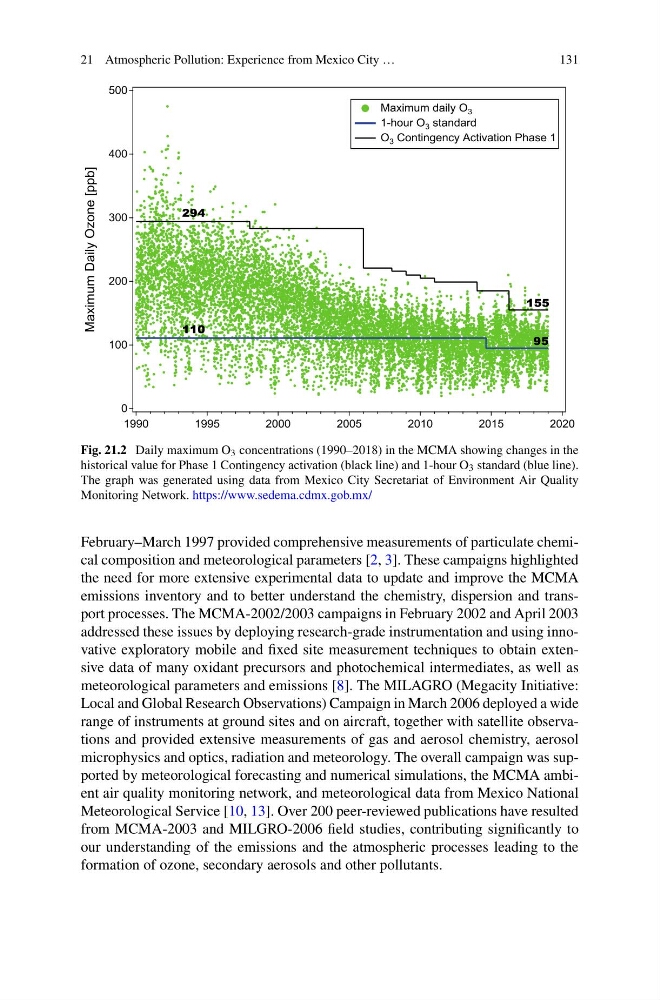
Fig. 21.2 Daily maximum O 3 concentrations (1990–2018) in the MCMA showing changes in the
historical value for Phase 1 Contingency activation (black line) and 1-hour O 3 standard (blue line).
The graph was generated using data from Mexico City Secretariat of Environment Air Quality
Monitoring Network. https://www.sedema.cdmx.gob.mx/
February–March 1997 provided comprehensive measurements of particulate chemical composition and meteorological parameters [2, 3]. These campaigns highlighted
the need for more extensive experimental data to update and improve the MCMA
emissions inventory and to better understand the chemistry, dispersion and transport processes. The MCMA-2002/2003 campaigns in February 2002 and April 2003
addressed these issues by deploying research-grade instrumentation and using innovative exploratory mobile and fixed site measurement techniques to obtain extensive data of many oxidant precursors and photochemical intermediates, as well as
meteorological parameters and emissions [8]. The MILAGRO (Megacity Initiative:
Local and Global Research Observations) Campaign in March 2006 deployed a wide
range of instruments at ground sites and on aircraft, together with satellite observations and provided extensive measurements of gas and aerosol chemistry, aerosol
microphysics and optics, radiation and meteorology. The overall campaign was supported by meteorological forecasting and numerical simulations, the MCMA ambient air quality monitoring network, and meteorological data from Mexico National
Meteorological Service [10, 13]. Over 200 peer-reviewed publications have resulted
from MCMA-2003 and MILGRO-2006 field studies, contributing significantly to
our understanding of the emissions and the atmospheric processes leading to the
formation of ozone, secondary aerosols and other pollutants.
131
Fig. 21.2 Daily maximum O 3 concentrations (1990–2018) in the MCMA showing changes in the
historical value for Phase 1 Contingency activation (black line) and 1-hour O 3 standard (blue line).
The graph was generated using data from Mexico City Secretariat of Environment Air Quality
Monitoring Network. https://www.sedema.cdmx.gob.mx/
February–March 1997 provided comprehensive measurements of particulate chemical composition and meteorological parameters [2, 3]. These campaigns highlighted
the need for more extensive experimental data to update and improve the MCMA
emissions inventory and to better understand the chemistry, dispersion and transport processes. The MCMA-2002/2003 campaigns in February 2002 and April 2003
addressed these issues by deploying research-grade instrumentation and using innovative exploratory mobile and fixed site measurement techniques to obtain extensive data of many oxidant precursors and photochemical intermediates, as well as
meteorological parameters and emissions [8]. The MILAGRO (Megacity Initiative:
Local and Global Research Observations) Campaign in March 2006 deployed a wide
range of instruments at ground sites and on aircraft, together with satellite observations and provided extensive measurements of gas and aerosol chemistry, aerosol
microphysics and optics, radiation and meteorology. The overall campaign was supported by meteorological forecasting and numerical simulations, the MCMA ambient air quality monitoring network, and meteorological data from Mexico National
Meteorological Service [10, 13]. Over 200 peer-reviewed publications have resulted
from MCMA-2003 and MILGRO-2006 field studies, contributing significantly to
our understanding of the emissions and the atmospheric processes leading to the
formation of ozone, secondary aerosols and other pollutants.