

86
P. L. Jackson et al.
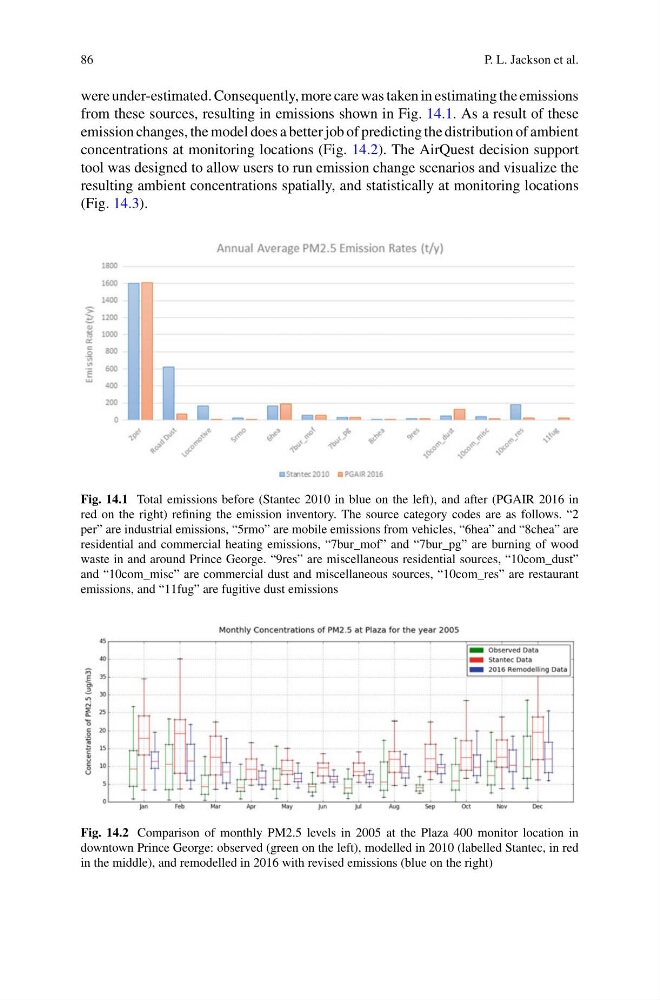
were under-estimated. Consequently, more care was taken in estimating the emissions
from these sources, resulting in emissions shown in Fig. 14.1. As a result of these
emission changes, the model does a better job of predicting the distribution of ambient
concentrations at monitoring locations (Fig. 14.2). The AirQuest decision support
tool was designed to allow users to run emission change scenarios and visualize the
resulting ambient concentrations spatially, and statistically at monitoring locations
(Fig. 14.3).
Fig. 14.1 Total emissions before (Stantec 2010 in blue on the left), and after (PGAIR 2016 in
red on the right) refining the emission inventory. The source category codes are as follows. “2
per” are industrial emissions, “5rmo” are mobile emissions from vehicles, “6hea” and “8chea” are
residential and commercial heating emissions, “7bur_mof” and “7bur_pg” are burning of wood
waste in and around Prince George. “9res” are miscellaneous residential sources, “10com_dust”
and “10com_misc” are commercial dust and miscellaneous sources, “10com_res” are restaurant
emissions, and “11fug” are fugitive dust emissions
Fig. 14.2 Comparison of monthly PM2.5 levels in 2005 at the Plaza 400 monitor location in
downtown Prince George: observed (green on the left), modelled in 2010 (labelled Stantec, in red
in the middle), and remodelled in 2016 with revised emissions (blue on the right)
P. L. Jackson et al.
were under-estimated. Consequently, more care was taken in estimating the emissions
from these sources, resulting in emissions shown in Fig. 14.1. As a result of these
emission changes, the model does a better job of predicting the distribution of ambient
concentrations at monitoring locations (Fig. 14.2). The AirQuest decision support
tool was designed to allow users to run emission change scenarios and visualize the
resulting ambient concentrations spatially, and statistically at monitoring locations
(Fig. 14.3).
Fig. 14.1 Total emissions before (Stantec 2010 in blue on the left), and after (PGAIR 2016 in
red on the right) refining the emission inventory. The source category codes are as follows. “2
per” are industrial emissions, “5rmo” are mobile emissions from vehicles, “6hea” and “8chea” are
residential and commercial heating emissions, “7bur_mof” and “7bur_pg” are burning of wood
waste in and around Prince George. “9res” are miscellaneous residential sources, “10com_dust”
and “10com_misc” are commercial dust and miscellaneous sources, “10com_res” are restaurant
emissions, and “11fug” are fugitive dust emissions
Fig. 14.2 Comparison of monthly PM2.5 levels in 2005 at the Plaza 400 monitor location in
downtown Prince George: observed (green on the left), modelled in 2010 (labelled Stantec, in red
in the middle), and remodelled in 2016 with revised emissions (blue on the right)