

1.7 Elongation of Steel Specimens
9
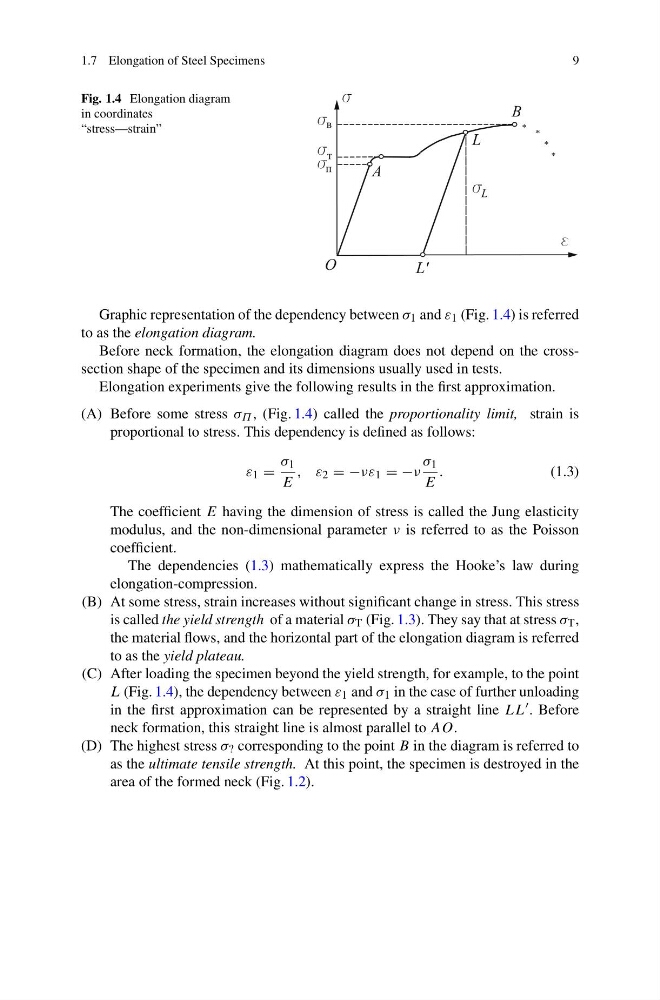
Fig. 1.4 Elongation diagram
in coordinates
“stress—strain”
Graphic representation of the dependency between σ 1 and ε 1 (Fig. 1.4) is referred
to as the elongation diagram.
Before neck formation, the elongation diagram does not depend on the crosssection shape of the specimen and its dimensions usually used in tests.
Elongation experiments give the following results in the first approximation.
(A) Before some stress σ Π , (Fig. 1.4) called the proportionality limit, strain is
proportional to stress. This dependency is defined as follows:
ε 1 =
σ 1
E
, ε 2 = −νε 1 = −ν
σ 1
E
.
(1.3)
The coefficient E having the dimension of stress is called the Jung elasticity
modulus, and the non-dimensional parameter ν is referred to as the Poisson
coefficient.
The dependencies (1.3) mathematically express the Hooke’s law during
elongation-compression.
(B) At some stress, strain increases without significant change in stress. This stress
is called the yield strength of a material σ T (Fig. 1.3). They say that at stress σ T ,
the material flows, and the horizontal part of the elongation diagram is referred
to as the yield plateau.
(C) After loading the specimen beyond the yield strength, for example, to the point
L (Fig. 1.4), the dependency between ε 1 and σ 1 in the case of further unloading
in the first approximation can be represented by a straight line LL . Before
neck formation, this straight line is almost parallel to AO.
(D) The highest stress σ ? corresponding to the point B in the diagram is referred to
as the ultimate tensile strength. At this point, the specimen is destroyed in the
area of the formed neck (Fig. 1.2).
9
Fig. 1.4 Elongation diagram
in coordinates
“stress—strain”
Graphic representation of the dependency between σ 1 and ε 1 (Fig. 1.4) is referred
to as the elongation diagram.
Before neck formation, the elongation diagram does not depend on the crosssection shape of the specimen and its dimensions usually used in tests.
Elongation experiments give the following results in the first approximation.
(A) Before some stress σ Π , (Fig. 1.4) called the proportionality limit, strain is
proportional to stress. This dependency is defined as follows:
ε 1 =
σ 1
E
, ε 2 = −νε 1 = −ν
σ 1
E
.
(1.3)
The coefficient E having the dimension of stress is called the Jung elasticity
modulus, and the non-dimensional parameter ν is referred to as the Poisson
coefficient.
The dependencies (1.3) mathematically express the Hooke’s law during
elongation-compression.
(B) At some stress, strain increases without significant change in stress. This stress
is called the yield strength of a material σ T (Fig. 1.3). They say that at stress σ T ,
the material flows, and the horizontal part of the elongation diagram is referred
to as the yield plateau.
(C) After loading the specimen beyond the yield strength, for example, to the point
L (Fig. 1.4), the dependency between ε 1 and σ 1 in the case of further unloading
in the first approximation can be represented by a straight line LL . Before
neck formation, this straight line is almost parallel to AO.
(D) The highest stress σ ? corresponding to the point B in the diagram is referred to
as the ultimate tensile strength. At this point, the specimen is destroyed in the
area of the formed neck (Fig. 1.2).