

14 Numerical Study on the Teeth Installation Parameters: Shift …
193
The results of shift effect show the critical role of external teeth displacement.
The found feature is more pronounceable for the case of lower prosthesis basis. In
the case of upper prosthesis basis, the stress distribution is fragmentary with local
maximums at the teeth vicinity or artificial notches.
14.4.2 Study on the Tilt Angle Effect
The same calculations were performed for the case of teeth blocks that are located
at the normal installation line but have a tilt angle. There are two configurations:
oral and external tilt angles as shown in Fig. 14.4c, d. The applied pressures are
listed in Table 14.1 for the corresponding teeth block. The results of calculations are
presented in Figs. 14.7 and 14.8.
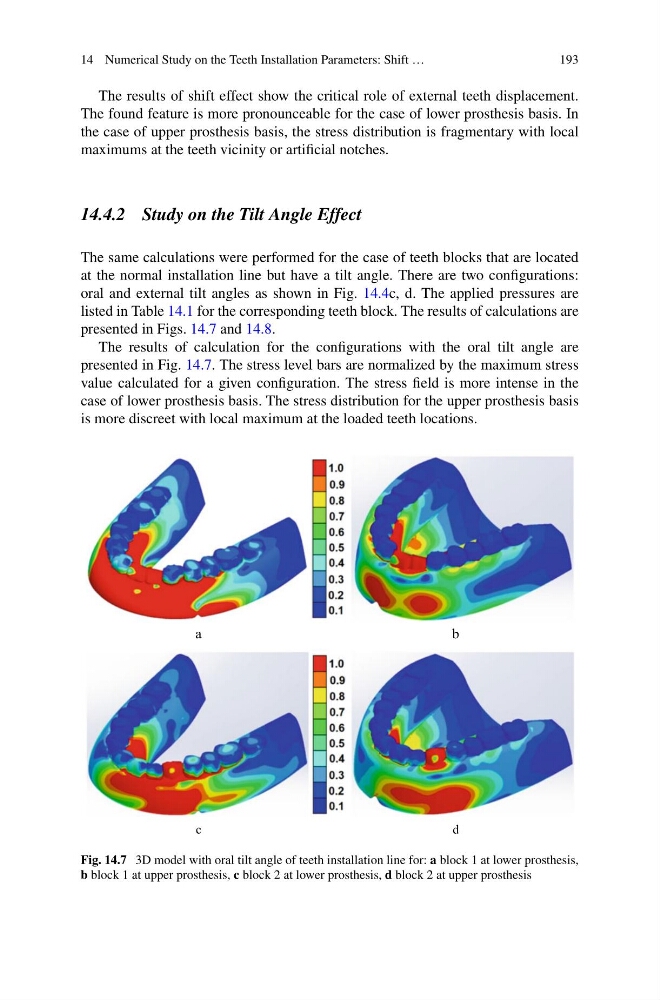
The results of calculation for the configurations with the oral tilt angle are
presented in Fig. 14.7. The stress level bars are normalized by the maximum stress
value calculated for a given configuration. The stress field is more intense in the
case of lower prosthesis basis. The stress distribution for the upper prosthesis basis
is more discreet with local maximum at the loaded teeth locations.
a
b
c
d
Fig. 14.7 3D model with oral tilt angle of teeth installation line for: a block 1 at lower prosthesis,
b block 1 at upper prosthesis, c block 2 at lower prosthesis, d block 2 at upper prosthesis
193
The results of shift effect show the critical role of external teeth displacement.
The found feature is more pronounceable for the case of lower prosthesis basis. In
the case of upper prosthesis basis, the stress distribution is fragmentary with local
maximums at the teeth vicinity or artificial notches.
14.4.2 Study on the Tilt Angle Effect
The same calculations were performed for the case of teeth blocks that are located
at the normal installation line but have a tilt angle. There are two configurations:
oral and external tilt angles as shown in Fig. 14.4c, d. The applied pressures are
listed in Table 14.1 for the corresponding teeth block. The results of calculations are
presented in Figs. 14.7 and 14.8.
The results of calculation for the configurations with the oral tilt angle are
presented in Fig. 14.7. The stress level bars are normalized by the maximum stress
value calculated for a given configuration. The stress field is more intense in the
case of lower prosthesis basis. The stress distribution for the upper prosthesis basis
is more discreet with local maximum at the loaded teeth locations.
a
b
c
d
Fig. 14.7 3D model with oral tilt angle of teeth installation line for: a block 1 at lower prosthesis,
b block 1 at upper prosthesis, c block 2 at lower prosthesis, d block 2 at upper prosthesis