

10 Thruster Rotation Angle Control During Contactless Removal …
137
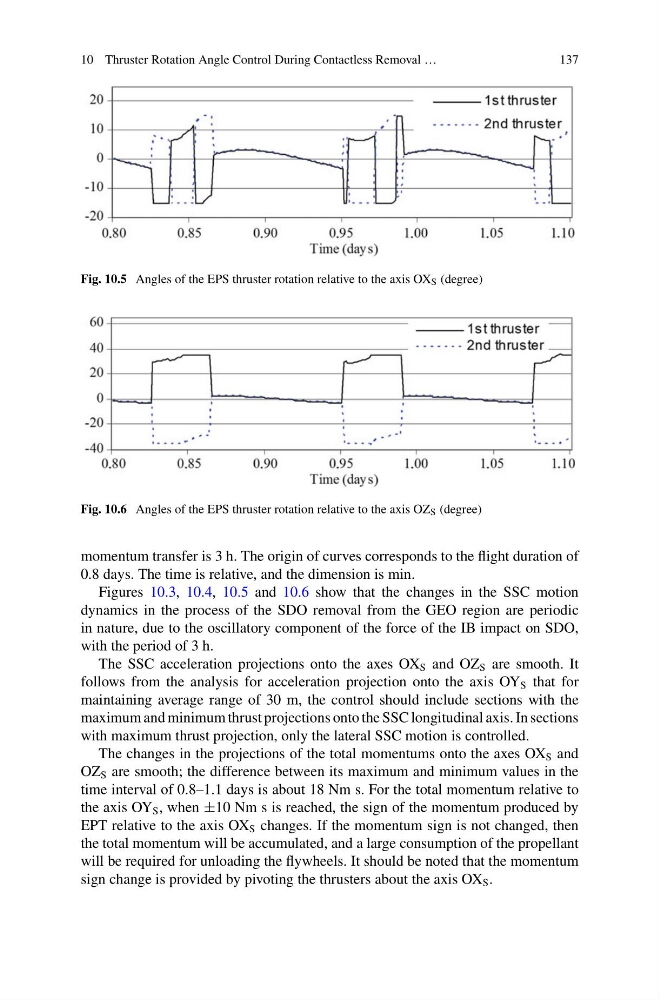
Fig. 10.5 Angles of the EPS thruster rotation relative to the axis OX S (degree)
Fig. 10.6 Angles of the EPS thruster rotation relative to the axis OZ S (degree)
momentum transfer is 3 h. The origin of curves corresponds to the flight duration of
0.8 days. The time is relative, and the dimension is min.
Figures 10.3, 10.4, 10.5 and 10.6 show that the changes in the SSC motion
dynamics in the process of the SDO removal from the GEO region are periodic
in nature, due to the oscillatory component of the force of the IB impact on SDO,
with the period of 3 h.
The SSC acceleration projections onto the axes OX S and OZ S are smooth. It
follows from the analysis for acceleration projection onto the axis OY S that for
maintaining average range of 30 m, the control should include sections with the
maximum and minimum thrust projections onto the SSC longitudinal axis. In sections
with maximum thrust projection, only the lateral SSC motion is controlled.
The changes in the projections of the total momentums onto the axes OX S and
OZ S are smooth; the difference between its maximum and minimum values in the
time interval of 0.8–1.1 days is about 18 Nm s. For the total momentum relative to
the axis OY S , when ±10 Nm s is reached, the sign of the momentum produced by
EPT relative to the axis OX S changes. If the momentum sign is not changed, then
the total momentum will be accumulated, and a large consumption of the propellant
will be required for unloading the flywheels. It should be noted that the momentum
sign change is provided by pivoting the thrusters about the axis OX S .
137
Fig. 10.5 Angles of the EPS thruster rotation relative to the axis OX S (degree)
Fig. 10.6 Angles of the EPS thruster rotation relative to the axis OZ S (degree)
momentum transfer is 3 h. The origin of curves corresponds to the flight duration of
0.8 days. The time is relative, and the dimension is min.
Figures 10.3, 10.4, 10.5 and 10.6 show that the changes in the SSC motion
dynamics in the process of the SDO removal from the GEO region are periodic
in nature, due to the oscillatory component of the force of the IB impact on SDO,
with the period of 3 h.
The SSC acceleration projections onto the axes OX S and OZ S are smooth. It
follows from the analysis for acceleration projection onto the axis OY S that for
maintaining average range of 30 m, the control should include sections with the
maximum and minimum thrust projections onto the SSC longitudinal axis. In sections
with maximum thrust projection, only the lateral SSC motion is controlled.
The changes in the projections of the total momentums onto the axes OX S and
OZ S are smooth; the difference between its maximum and minimum values in the
time interval of 0.8–1.1 days is about 18 Nm s. For the total momentum relative to
the axis OY S , when ±10 Nm s is reached, the sign of the momentum produced by
EPT relative to the axis OX S changes. If the momentum sign is not changed, then
the total momentum will be accumulated, and a large consumption of the propellant
will be required for unloading the flywheels. It should be noted that the momentum
sign change is provided by pivoting the thrusters about the axis OX S .