

112
A. I. Lopato
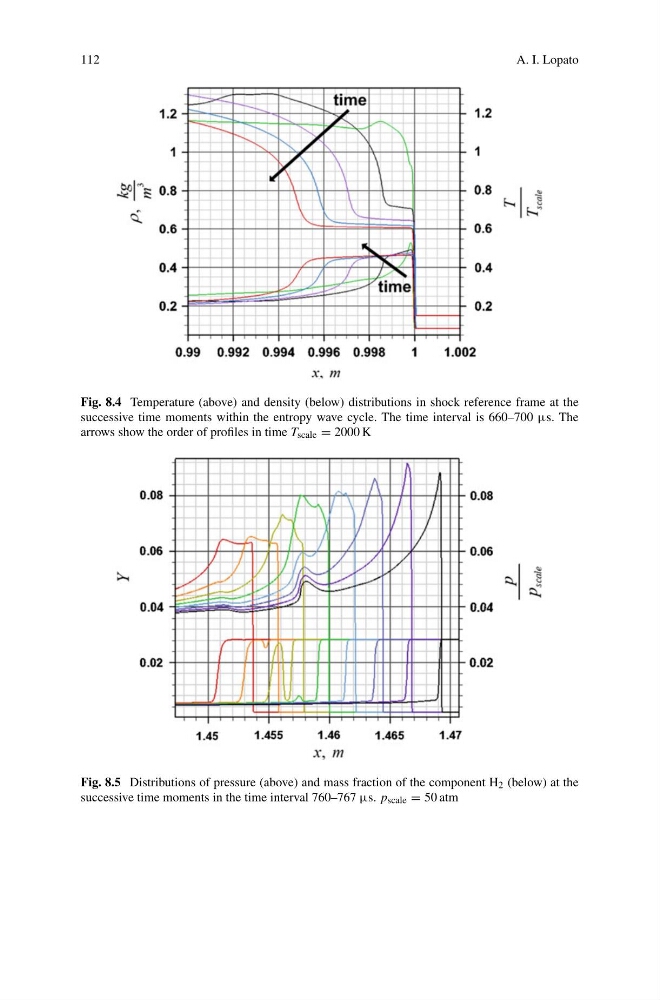
Fig. 8.4 Temperature (above) and density (below) distributions in shock reference frame at the
successive time moments within the entropy wave cycle. The time interval is 660–700 µs. The
arrows show the order of profiles in time T scale = 2000 K
Fig. 8.5 Distributions of pressure (above) and mass fraction of the component H 2 (below) at the
successive time moments in the time interval 760–767 µs. p scale = 50 atm
A. I. Lopato
Fig. 8.4 Temperature (above) and density (below) distributions in shock reference frame at the
successive time moments within the entropy wave cycle. The time interval is 660–700 µs. The
arrows show the order of profiles in time T scale = 2000 K
Fig. 8.5 Distributions of pressure (above) and mass fraction of the component H 2 (below) at the
successive time moments in the time interval 760–767 µs. p scale = 50 atm