

Water Climate Food Nexus for Green Sustainability
599
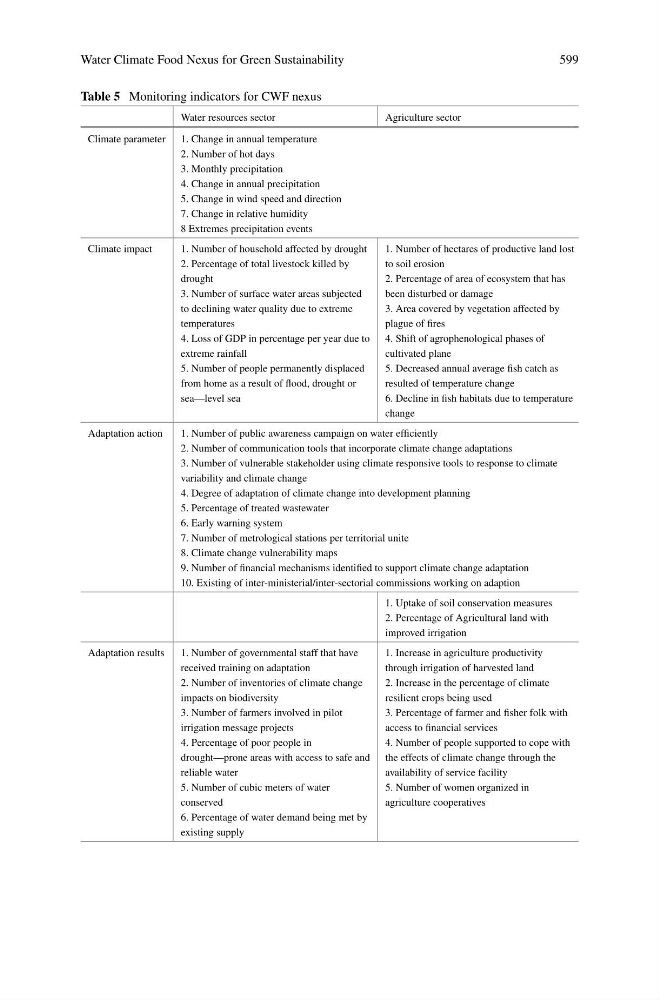
Table 5 Monitoring indicators for CWF nexus
Water resources sector
Agriculture sector
Climate parameter 1. Change in annual temperature
2. Number of hot days
3. Monthly precipitation
4. Change in annual precipitation
5. Change in wind speed and direction
7. Change in relative humidity
8 Extremes precipitation events
Climate impact
1. Number of household affected by drought
2. Percentage of total livestock killed by
drought
3. Number of surface water areas subjected
to declining water quality due to extreme
temperatures
4. Loss of GDP in percentage per year due to
extreme rainfall
5. Number of people permanently displaced
from home as a result of flood, drought or
sea—level sea
1. Number of hectares of productive land lost
to soil erosion
2. Percentage of area of ecosystem that has
been disturbed or damage
3. Area covered by vegetation affected by
plague of fires
4. Shift of agrophenological phases of
cultivated plane
5. Decreased annual average fish catch as
resulted of temperature change
6. Decline in fish habitats due to temperature
change
Adaptation action
1. Number of public awareness campaign on water efficiently
2. Number of communication tools that incorporate climate change adaptations
3. Number of vulnerable stakeholder using climate responsive tools to response to climate
variability and climate change
4. Degree of adaptation of climate change into development planning
5. Percentage of treated wastewater
6. Early warning system
7. Number of metrological stations per territorial unite
8. Climate change vulnerability maps
9. Number of financial mechanisms identified to support climate change adaptation
10. Existing of inter-ministerial/inter-sectorial commissions working on adaption
1. Uptake of soil conservation measures
2. Percentage of Agricultural land with
improved irrigation
Adaptation results
1. Number of governmental staff that have
received training on adaptation
2. Number of inventories of climate change
impacts on biodiversity
3. Number of farmers involved in pilot
irrigation message projects
4. Percentage of poor people in
drought—prone areas with access to safe and
reliable water
5. Number of cubic meters of water
conserved
6. Percentage of water demand being met by
existing supply
1. Increase in agriculture productivity
through irrigation of harvested land
2. Increase in the percentage of climate
resilient crops being used
3. Percentage of farmer and fisher folk with
access to financial services
4. Number of people supported to cope with
the effects of climate change through the
availability of service facility
5. Number of women organized in
agriculture cooperatives
599
Table 5 Monitoring indicators for CWF nexus
Water resources sector
Agriculture sector
Climate parameter 1. Change in annual temperature
2. Number of hot days
3. Monthly precipitation
4. Change in annual precipitation
5. Change in wind speed and direction
7. Change in relative humidity
8 Extremes precipitation events
Climate impact
1. Number of household affected by drought
2. Percentage of total livestock killed by
drought
3. Number of surface water areas subjected
to declining water quality due to extreme
temperatures
4. Loss of GDP in percentage per year due to
extreme rainfall
5. Number of people permanently displaced
from home as a result of flood, drought or
sea—level sea
1. Number of hectares of productive land lost
to soil erosion
2. Percentage of area of ecosystem that has
been disturbed or damage
3. Area covered by vegetation affected by
plague of fires
4. Shift of agrophenological phases of
cultivated plane
5. Decreased annual average fish catch as
resulted of temperature change
6. Decline in fish habitats due to temperature
change
Adaptation action
1. Number of public awareness campaign on water efficiently
2. Number of communication tools that incorporate climate change adaptations
3. Number of vulnerable stakeholder using climate responsive tools to response to climate
variability and climate change
4. Degree of adaptation of climate change into development planning
5. Percentage of treated wastewater
6. Early warning system
7. Number of metrological stations per territorial unite
8. Climate change vulnerability maps
9. Number of financial mechanisms identified to support climate change adaptation
10. Existing of inter-ministerial/inter-sectorial commissions working on adaption
1. Uptake of soil conservation measures
2. Percentage of Agricultural land with
improved irrigation
Adaptation results
1. Number of governmental staff that have
received training on adaptation
2. Number of inventories of climate change
impacts on biodiversity
3. Number of farmers involved in pilot
irrigation message projects
4. Percentage of poor people in
drought—prone areas with access to safe and
reliable water
5. Number of cubic meters of water
conserved
6. Percentage of water demand being met by
existing supply
1. Increase in agriculture productivity
through irrigation of harvested land
2. Increase in the percentage of climate
resilient crops being used
3. Percentage of farmer and fisher folk with
access to financial services
4. Number of people supported to cope with
the effects of climate change through the
availability of service facility
5. Number of women organized in
agriculture cooperatives