

430
T. S. K. M. Rabie
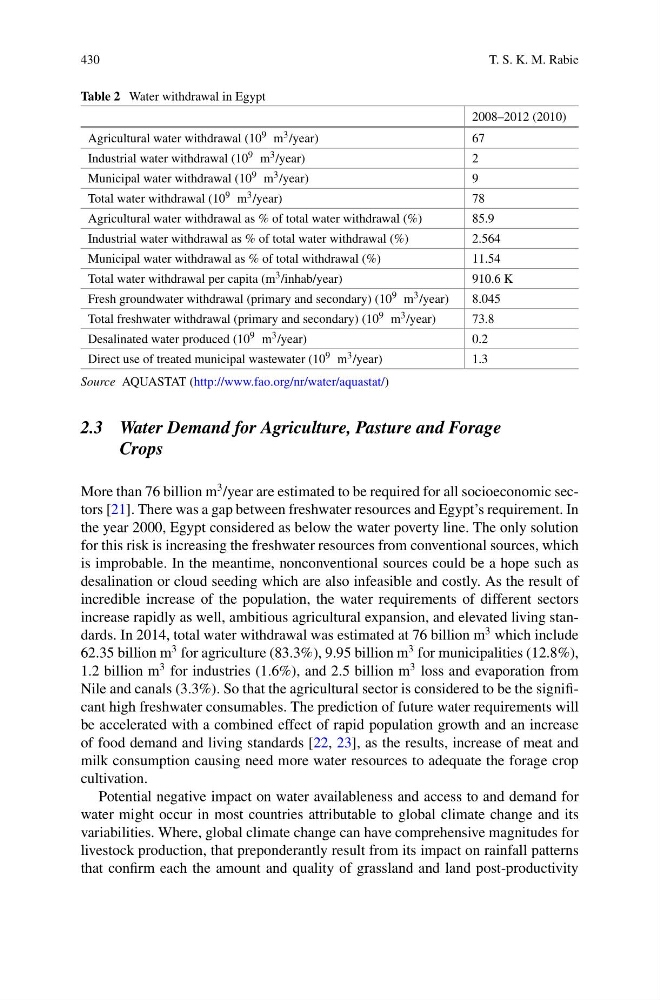
Table 2 Water withdrawal in Egypt
2008–2012 (2010)
Agricultural water withdrawal (10 9 m 3 /year)
67
Industrial water withdrawal (10 9 m 3 /year)
2
Municipal water withdrawal (10 9 m 3 /year)
9
Total water withdrawal (10 9 m 3 /year)
78
Agricultural water withdrawal as % of total water withdrawal (%)
85.9
Industrial water withdrawal as % of total water withdrawal (%)
2.564
Municipal water withdrawal as % of total withdrawal (%)
11.54
Total water withdrawal per capita (m 3 /inhab/year)
910.6 K
Fresh groundwater withdrawal (primary and secondary) (10 9 m 3 /year)
8.045
Total freshwater withdrawal (primary and secondary) (10 9 m 3 /year)
73.8
Desalinated water produced (10 9 m 3 /year)
0.2
Direct use of treated municipal wastewater (10 9 m 3 /year)
1.3
Source AQUASTAT (http://www.fao.org/nr/water/aquastat/)
2.3 Water Demand for Agriculture, Pasture and Forage
Crops
More than 76 billion m
3 /year are estimated to be required for all socioeconomic sectors [21]. There was a gap between freshwater resources and Egypt’s requirement. In
the year 2000, Egypt considered as below the water poverty line. The only solution
for this risk is increasing the freshwater resources from conventional sources, which
is improbable. In the meantime, nonconventional sources could be a hope such as
desalination or cloud seeding which are also infeasible and costly. As the result of
incredible increase of the population, the water requirements of different sectors
increase rapidly as well, ambitious agricultural expansion, and elevated living standards. In 2014, total water withdrawal was estimated at 76 billion m
3 which include
62.35 billion m
3 for agriculture (83.3%), 9.95 billion m
3 for municipalities (12.8%),
1.2 billion m
3 for industries (1.6%), and 2.5 billion m
3 loss and evaporation from
Nile and canals (3.3%). So that the agricultural sector is considered to be the significant high freshwater consumables. The prediction of future water requirements will
be accelerated with a combined effect of rapid population growth and an increase
of food demand and living standards [22, 23], as the results, increase of meat and
milk consumption causing need more water resources to adequate the forage crop
cultivation.
Potential negative impact on water availableness and access to and demand for
water might occur in most countries attributable to global climate change and its
variabilities. Where, global climate change can have comprehensive magnitudes for
livestock production, that preponderantly result from its impact on rainfall patterns
that confirm each the amount and quality of grassland and land post-productivity
T. S. K. M. Rabie
Table 2 Water withdrawal in Egypt
2008–2012 (2010)
Agricultural water withdrawal (10 9 m 3 /year)
67
Industrial water withdrawal (10 9 m 3 /year)
2
Municipal water withdrawal (10 9 m 3 /year)
9
Total water withdrawal (10 9 m 3 /year)
78
Agricultural water withdrawal as % of total water withdrawal (%)
85.9
Industrial water withdrawal as % of total water withdrawal (%)
2.564
Municipal water withdrawal as % of total withdrawal (%)
11.54
Total water withdrawal per capita (m 3 /inhab/year)
910.6 K
Fresh groundwater withdrawal (primary and secondary) (10 9 m 3 /year)
8.045
Total freshwater withdrawal (primary and secondary) (10 9 m 3 /year)
73.8
Desalinated water produced (10 9 m 3 /year)
0.2
Direct use of treated municipal wastewater (10 9 m 3 /year)
1.3
Source AQUASTAT (http://www.fao.org/nr/water/aquastat/)
2.3 Water Demand for Agriculture, Pasture and Forage
Crops
More than 76 billion m
3 /year are estimated to be required for all socioeconomic sectors [21]. There was a gap between freshwater resources and Egypt’s requirement. In
the year 2000, Egypt considered as below the water poverty line. The only solution
for this risk is increasing the freshwater resources from conventional sources, which
is improbable. In the meantime, nonconventional sources could be a hope such as
desalination or cloud seeding which are also infeasible and costly. As the result of
incredible increase of the population, the water requirements of different sectors
increase rapidly as well, ambitious agricultural expansion, and elevated living standards. In 2014, total water withdrawal was estimated at 76 billion m
3 which include
62.35 billion m
3 for agriculture (83.3%), 9.95 billion m
3 for municipalities (12.8%),
1.2 billion m
3 for industries (1.6%), and 2.5 billion m
3 loss and evaporation from
Nile and canals (3.3%). So that the agricultural sector is considered to be the significant high freshwater consumables. The prediction of future water requirements will
be accelerated with a combined effect of rapid population growth and an increase
of food demand and living standards [22, 23], as the results, increase of meat and
milk consumption causing need more water resources to adequate the forage crop
cultivation.
Potential negative impact on water availableness and access to and demand for
water might occur in most countries attributable to global climate change and its
variabilities. Where, global climate change can have comprehensive magnitudes for
livestock production, that preponderantly result from its impact on rainfall patterns
that confirm each the amount and quality of grassland and land post-productivity