

280
S. Ouda
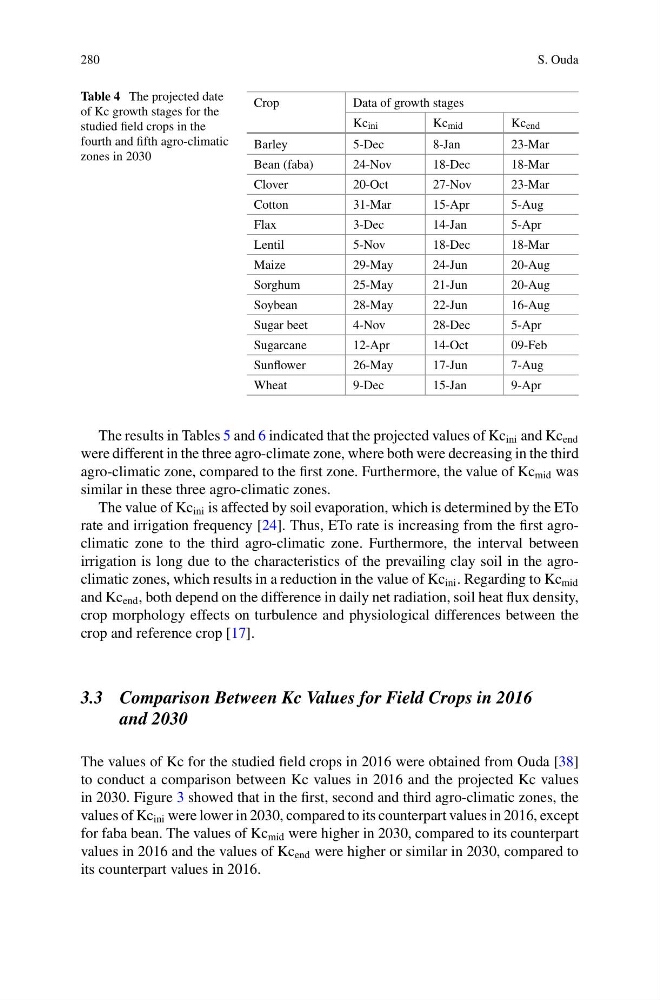
Table 4 The projected date
of Kc growth stages for the
studied field crops in the
fourth and fifth agro-climatic
zones in 2030
Crop
Data of growth stages
Kc ini
Kc mid
Kc end
Barley
5-Dec
8-Jan
23-Mar
Bean (faba)
24-Nov
18-Dec
18-Mar
Clover
20-Oct
27-Nov
23-Mar
Cotton
31-Mar
15-Apr
5-Aug
Flax
3-Dec
14-Jan
5-Apr
Lentil
5-Nov
18-Dec
18-Mar
Maize
29-May
24-Jun
20-Aug
Sorghum
25-May
21-Jun
20-Aug
Soybean
28-May
22-Jun
16-Aug
Sugar beet
4-Nov
28-Dec
5-Apr
Sugarcane
12-Apr
14-Oct
09-Feb
Sunflower
26-May
17-Jun
7-Aug
Wheat
9-Dec
15-Jan
9-Apr
The results in Tables 5 and 6 indicated that the projected values of Kc ini and Kc end
were different in the three agro-climate zone, where both were decreasing in the third
agro-climatic zone, compared to the first zone. Furthermore, the value of Kc mid was
similar in these three agro-climatic zones.
The value of Kc ini is affected by soil evaporation, which is determined by the ETo
rate and irrigation frequency [24]. Thus, ETo rate is increasing from the first agroclimatic zone to the third agro-climatic zone. Furthermore, the interval between
irrigation is long due to the characteristics of the prevailing clay soil in the agroclimatic zones, which results in a reduction in the value of Kc ini . Regarding to Kc mid
and Kc end , both depend on the difference in daily net radiation, soil heat flux density,
crop morphology effects on turbulence and physiological differences between the
crop and reference crop [17].
3.3 Comparison Between Kc Values for Field Crops in 2016
and 2030
The values of Kc for the studied field crops in 2016 were obtained from Ouda [38]
to conduct a comparison between Kc values in 2016 and the projected Kc values
in 2030. Figure 3 showed that in the first, second and third agro-climatic zones, the
values of Kc ini were lower in 2030, compared to its counterpart values in 2016, except
for faba bean. The values of Kc mid were higher in 2030, compared to its counterpart
values in 2016 and the values of Kc end were higher or similar in 2030, compared to
its counterpart values in 2016.
S. Ouda
Table 4 The projected date
of Kc growth stages for the
studied field crops in the
fourth and fifth agro-climatic
zones in 2030
Crop
Data of growth stages
Kc ini
Kc mid
Kc end
Barley
5-Dec
8-Jan
23-Mar
Bean (faba)
24-Nov
18-Dec
18-Mar
Clover
20-Oct
27-Nov
23-Mar
Cotton
31-Mar
15-Apr
5-Aug
Flax
3-Dec
14-Jan
5-Apr
Lentil
5-Nov
18-Dec
18-Mar
Maize
29-May
24-Jun
20-Aug
Sorghum
25-May
21-Jun
20-Aug
Soybean
28-May
22-Jun
16-Aug
Sugar beet
4-Nov
28-Dec
5-Apr
Sugarcane
12-Apr
14-Oct
09-Feb
Sunflower
26-May
17-Jun
7-Aug
Wheat
9-Dec
15-Jan
9-Apr
The results in Tables 5 and 6 indicated that the projected values of Kc ini and Kc end
were different in the three agro-climate zone, where both were decreasing in the third
agro-climatic zone, compared to the first zone. Furthermore, the value of Kc mid was
similar in these three agro-climatic zones.
The value of Kc ini is affected by soil evaporation, which is determined by the ETo
rate and irrigation frequency [24]. Thus, ETo rate is increasing from the first agroclimatic zone to the third agro-climatic zone. Furthermore, the interval between
irrigation is long due to the characteristics of the prevailing clay soil in the agroclimatic zones, which results in a reduction in the value of Kc ini . Regarding to Kc mid
and Kc end , both depend on the difference in daily net radiation, soil heat flux density,
crop morphology effects on turbulence and physiological differences between the
crop and reference crop [17].
3.3 Comparison Between Kc Values for Field Crops in 2016
and 2030
The values of Kc for the studied field crops in 2016 were obtained from Ouda [38]
to conduct a comparison between Kc values in 2016 and the projected Kc values
in 2030. Figure 3 showed that in the first, second and third agro-climatic zones, the
values of Kc ini were lower in 2030, compared to its counterpart values in 2016, except
for faba bean. The values of Kc mid were higher in 2030, compared to its counterpart
values in 2016 and the values of Kc end were higher or similar in 2030, compared to
its counterpart values in 2016.