

98
S. A. El.-M. M. Abd El-Azeem
Keywords Climate changes · Egypt · Enzyme activity · Microbial biomass ·
Microbial community
1 Introduction
Climate is the principal of all environmental aspects, it controls not only the growth
and development of the plants but also their geographical distribution. Therefore, the
main crops type and soil properties particularly biological features are correlated to
the different climatic conditions [1]. Egypt is in the northeast of Africa extending
approximately between 22° and 31°36
N and 25° and 35° E with an area of approximately one million km
2 . It is bounded by the Mediterranean Sea to the north and the
Red Sea to the east. Egypt is generally homogeneous with low relief. The altitude
varies gently from 133 m below the mean sea level (Qattara Depression) to nearly
2500 m (Southern Sinai), with an average of 306 m. Southern Sinai and the Red
Sea hills are the most elevated areas, representing a topographic barrier for maritime
influences from the Red Sea. The climate of Egypt is an arid or desert climate and
generally characterized by moderate and rainy winters, hot and dry summers and
a relatively high number of sunny hours (10 h day
−1 ). The annual average rainfall
ranging from 60 to 190 mm along the Mediterranean coast to 25 to 60 mm in the
Nile delta, and less than 25 mm in upper Egypt and adjacent areas. The rainy season
extends only from September to April. The average maximum and minimum temperatures are 33.3 and 21.1 °C, respectively. January (July) is the coldest (warmest)
month with an average temperature of 19.3 °C (33.9 °C). The maximum temperatures in summer commonly exceed 30 °C, while winter minimum temperatures
rarely fall below 5 °C [2]. The general features of the soils of Egypt are very close
to climate and vegetation in this region, for example, low organic matter and biological activity [1]. Changes in temperature and precipitation in Egypt were estimated
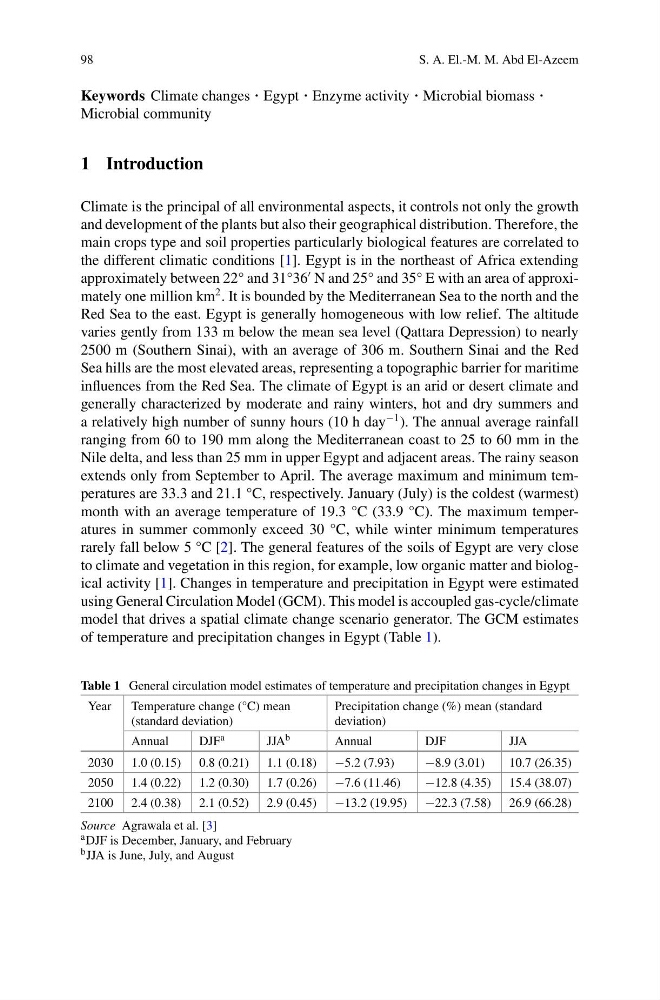
using General Circulation Model (GCM). This model is accoupled gas-cycle/climate
model that drives a spatial climate change scenario generator. The GCM estimates
of temperature and precipitation changes in Egypt (Table 1).
Table 1 General circulation model estimates of temperature and precipitation changes in Egypt
Year
Temperature change (°C) mean
(standard deviation)
Precipitation change (%) mean (standard
deviation)
Annual
DJF a
JJA b
Annual
DJF
JJA
2030 1.0 (0.15) 0.8 (0.21) 1.1 (0.18) −5.2 (7.93)
−8.9 (3.01)
10.7 (26.35)
2050 1.4 (0.22) 1.2 (0.30) 1.7 (0.26) −7.6 (11.46)
−12.8 (4.35) 15.4 (38.07)
2100 2.4 (0.38) 2.1 (0.52) 2.9 (0.45) −13.2 (19.95) −22.3 (7.58) 26.9 (66.28)
Source Agrawala et al. [3]
a DJF is December, January, and February
b JJA is June, July, and August
S. A. El.-M. M. Abd El-Azeem
Keywords Climate changes · Egypt · Enzyme activity · Microbial biomass ·
Microbial community
1 Introduction
Climate is the principal of all environmental aspects, it controls not only the growth
and development of the plants but also their geographical distribution. Therefore, the
main crops type and soil properties particularly biological features are correlated to
the different climatic conditions [1]. Egypt is in the northeast of Africa extending
approximately between 22° and 31°36
N and 25° and 35° E with an area of approximately one million km
2 . It is bounded by the Mediterranean Sea to the north and the
Red Sea to the east. Egypt is generally homogeneous with low relief. The altitude
varies gently from 133 m below the mean sea level (Qattara Depression) to nearly
2500 m (Southern Sinai), with an average of 306 m. Southern Sinai and the Red
Sea hills are the most elevated areas, representing a topographic barrier for maritime
influences from the Red Sea. The climate of Egypt is an arid or desert climate and
generally characterized by moderate and rainy winters, hot and dry summers and
a relatively high number of sunny hours (10 h day
−1 ). The annual average rainfall
ranging from 60 to 190 mm along the Mediterranean coast to 25 to 60 mm in the
Nile delta, and less than 25 mm in upper Egypt and adjacent areas. The rainy season
extends only from September to April. The average maximum and minimum temperatures are 33.3 and 21.1 °C, respectively. January (July) is the coldest (warmest)
month with an average temperature of 19.3 °C (33.9 °C). The maximum temperatures in summer commonly exceed 30 °C, while winter minimum temperatures
rarely fall below 5 °C [2]. The general features of the soils of Egypt are very close
to climate and vegetation in this region, for example, low organic matter and biological activity [1]. Changes in temperature and precipitation in Egypt were estimated
using General Circulation Model (GCM). This model is accoupled gas-cycle/climate
model that drives a spatial climate change scenario generator. The GCM estimates
of temperature and precipitation changes in Egypt (Table 1).
Table 1 General circulation model estimates of temperature and precipitation changes in Egypt
Year
Temperature change (°C) mean
(standard deviation)
Precipitation change (%) mean (standard
deviation)
Annual
DJF a
JJA b
Annual
DJF
JJA
2030 1.0 (0.15) 0.8 (0.21) 1.1 (0.18) −5.2 (7.93)
−8.9 (3.01)
10.7 (26.35)
2050 1.4 (0.22) 1.2 (0.30) 1.7 (0.26) −7.6 (11.46)
−12.8 (4.35) 15.4 (38.07)
2100 2.4 (0.38) 2.1 (0.52) 2.9 (0.45) −13.2 (19.95) −22.3 (7.58) 26.9 (66.28)
Source Agrawala et al. [3]
a DJF is December, January, and February
b JJA is June, July, and August