

Fig. 5
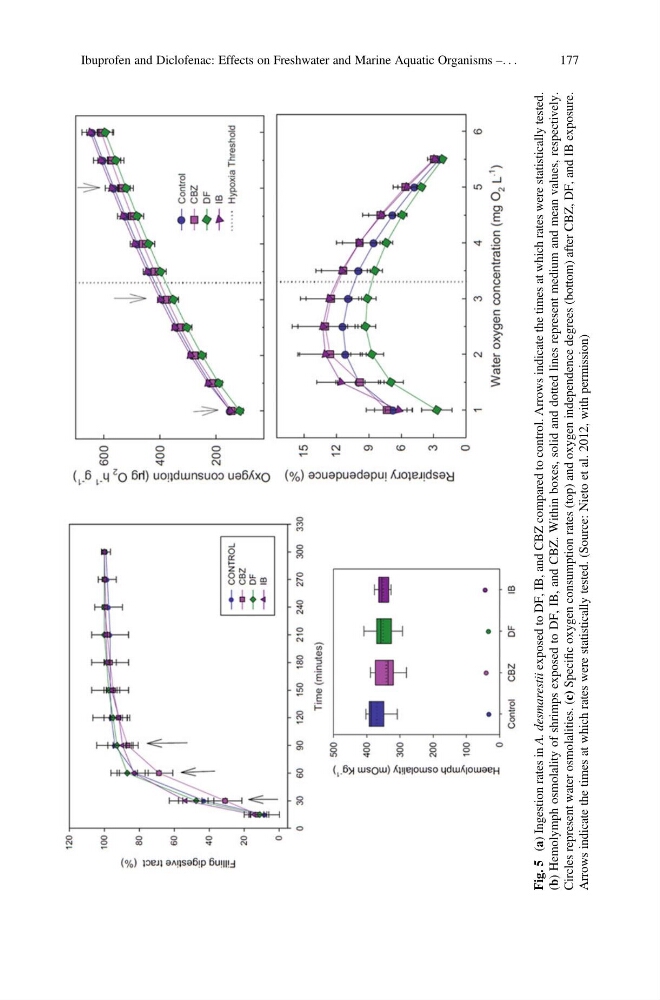
(a) Ingestion rates in A. desmarestii
exposed to DF, IB, and CBZ compared to control. Arrows indicate the times at which rates were statistically tested.
(b) Hemolymph osmolality of shrimps exposed to DF, IB, and CBZ. Within boxes, solid and dotted lines represent medium and mean values, respectively.
Circles represent water osmolalities. (c) Specific oxygen consumption rates (top) and oxygen independence degrees (bottom) after CBZ, DF, and IB exposure.
Arrows indicate the times at which rates were statistically tested. (Source: Nieto et al. 2012, with permission)
Ibuprofen and Diclofenac: Effects on Freshwater and Marine Aquatic Organisms –. . .
177
(a) Ingestion rates in A. desmarestii
exposed to DF, IB, and CBZ compared to control. Arrows indicate the times at which rates were statistically tested.
(b) Hemolymph osmolality of shrimps exposed to DF, IB, and CBZ. Within boxes, solid and dotted lines represent medium and mean values, respectively.
Circles represent water osmolalities. (c) Specific oxygen consumption rates (top) and oxygen independence degrees (bottom) after CBZ, DF, and IB exposure.
Arrows indicate the times at which rates were statistically tested. (Source: Nieto et al. 2012, with permission)
Ibuprofen and Diclofenac: Effects on Freshwater and Marine Aquatic Organisms –. . .
177