

7.8 Explosiveness of Mine Gases
271
7.8.2 Explosiveness Determinations with the USBM Method
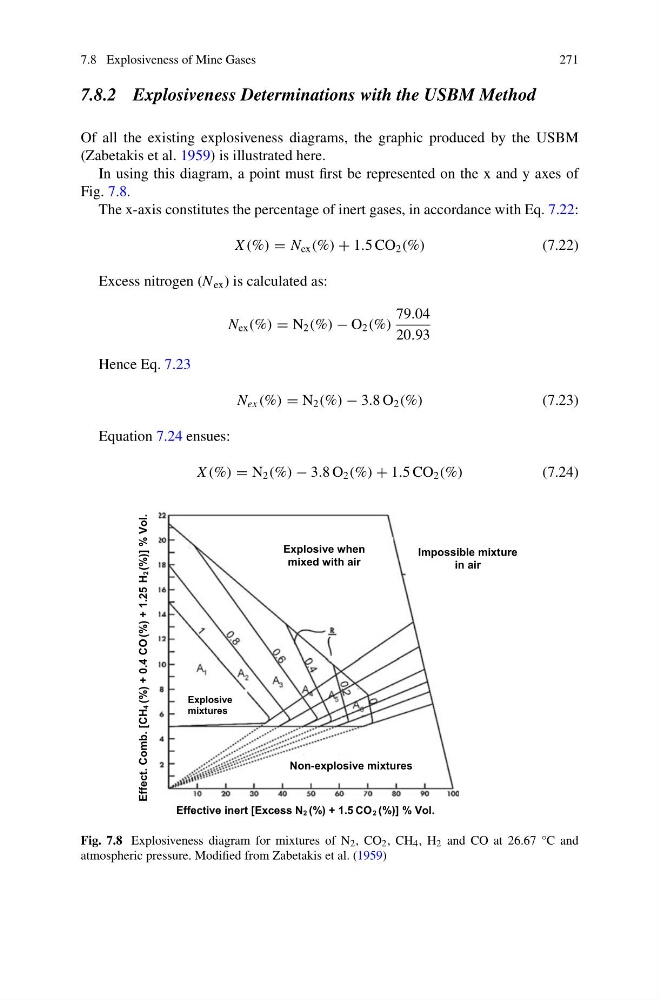
Of all the existing explosiveness diagrams, the graphic produced by the USBM
(Zabetakis et al. 1959) is illustrated here.
In using this diagram, a point must first be represented on the x and y axes of
Fig. 7.8.
The x-axis constitutes the percentage of inert gases, in accordance with Eq. 7.22:
X (%) = N ex (%) + 1.5 CO 2 (%)
(7.22)
Excess nitrogen (N ex ) is calculated as:
N ex (%) = N 2 (%) − O 2 (%)
79.04
20.93
Hence Eq. 7.23
N ex (%) = N 2 (%) − 3.8 O 2 (%)
(7.23)
Equation 7.24 ensues:
X (%) = N 2 (%) − 3.8 O 2 (%) + 1.5 CO 2 (%)
(7.24)
Explosive
mixtures
Explosive when
mixed with air
Impossible mixture
in air
Non-explosive mixtures
Effective inert [Excess N2 (%) + 1.5 CO2 (%)] % Vol.
Effect. Comb. [CH4 (%) + 0.4 CO (%) + 1.25 H2(%)] % Vol.
Fig. 7.8 Explosiveness diagram for mixtures of N 2 , CO 2 , CH 4 , H 2 and CO at 26.67 °C and
atmospheric pressure. Modified from Zabetakis et al. (1959)
271
7.8.2 Explosiveness Determinations with the USBM Method
Of all the existing explosiveness diagrams, the graphic produced by the USBM
(Zabetakis et al. 1959) is illustrated here.
In using this diagram, a point must first be represented on the x and y axes of
Fig. 7.8.
The x-axis constitutes the percentage of inert gases, in accordance with Eq. 7.22:
X (%) = N ex (%) + 1.5 CO 2 (%)
(7.22)
Excess nitrogen (N ex ) is calculated as:
N ex (%) = N 2 (%) − O 2 (%)
79.04
20.93
Hence Eq. 7.23
N ex (%) = N 2 (%) − 3.8 O 2 (%)
(7.23)
Equation 7.24 ensues:
X (%) = N 2 (%) − 3.8 O 2 (%) + 1.5 CO 2 (%)
(7.24)
Explosive
mixtures
Explosive when
mixed with air
Impossible mixture
in air
Non-explosive mixtures
Effective inert [Excess N2 (%) + 1.5 CO2 (%)] % Vol.
Effect. Comb. [CH4 (%) + 0.4 CO (%) + 1.25 H2(%)] % Vol.
Fig. 7.8 Explosiveness diagram for mixtures of N 2 , CO 2 , CH 4 , H 2 and CO at 26.67 °C and
atmospheric pressure. Modified from Zabetakis et al. (1959)