

2018b). Approximately 1500 tons of anaerobically digested distillery sludge is being
wasted per day in India (Kansal et al. 1998). On disposal of distillery sludge in the
aquatic and terrestrial ecosystem, it upsets natural food chains, immobilizes soil
nutrients, depresses microbial activity, and affects microflora and macrofauna as
well as human health. However, in nature, this toxic distillery sludge is slowly
converted into a soil amendment (compost) by microflora and/or macrofauna;
therefore, their use singly or in combination is popular nowadays for rapid recycling
of nutrients of distillery waste. The sludge environments could be effective incubators of a wide variety of resistant and adapted bacterial communities and should offer
an ideal source of potential ligninolytic enzyme producing potential bacteria suitable
for related industrial applications (Kumar and Chandra 2018; Chandra and Kumar
2017a). Consequently, investigations of distillery sludge bacterial communities and
its organic compounds have been reported.
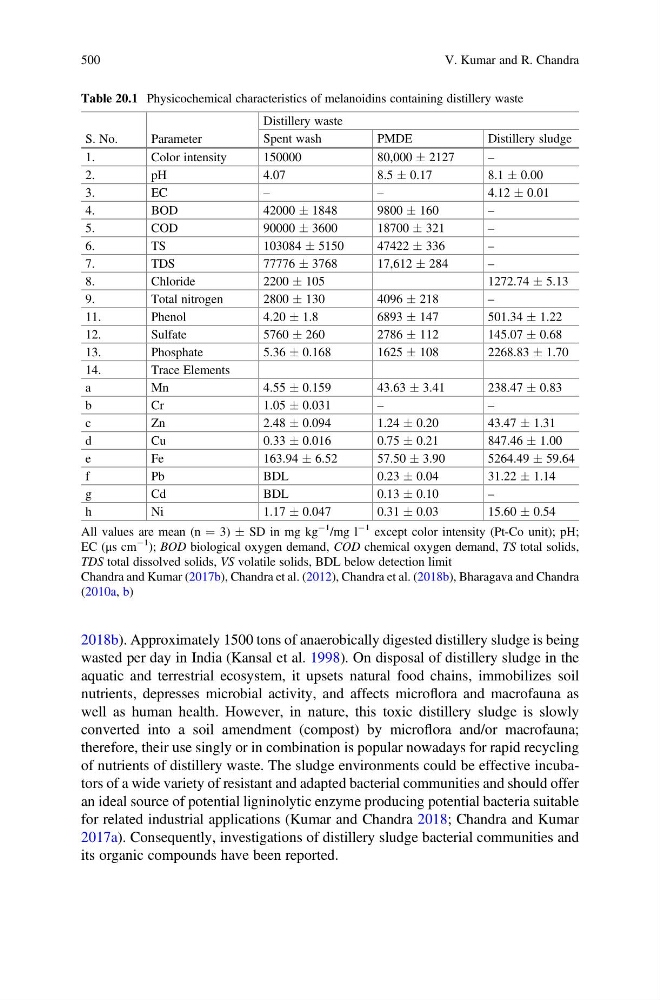
Table 20.1 Physicochemical characteristics of melanoidins containing distillery waste
S. No.
Parameter
Distillery waste
Spent wash
PMDE
Distillery sludge
1.
Color intensity
150000
80,000 Æ 2127
–
2.
pH
4.07
8.5 Æ 0.17
8.1 Æ 0.00
3.
EC
–
–
4.12 Æ 0.01
4.
BOD
42000 Æ 1848
9800 Æ 160
–
5.
COD
90000 Æ 3600
18700 Æ 321
–
6.
TS
103084 Æ 5150
47422 Æ 336
–
7.
TDS
77776 Æ 3768
17,612 Æ 284
–
8.
Chloride
2200 Æ 105
1272.74 Æ 5.13
9.
Total nitrogen
2800 Æ 130
4096 Æ 218
–
11.
Phenol
4.20 Æ 1.8
6893 Æ 147
501.34 Æ 1.22
12.
Sulfate
5760 Æ 260
2786 Æ 112
145.07 Æ 0.68
13.
Phosphate
5.36 Æ 0.168
1625 Æ 108
2268.83 Æ 1.70
14.
Trace Elements
a
Mn
4.55 Æ 0.159
43.63 Æ 3.41
238.47 Æ 0.83
b
Cr
1.05 Æ 0.031
–
–
c
Zn
2.48 Æ 0.094
1.24 Æ 0.20
43.47 Æ 1.31
d
Cu
0.33 Æ 0.016
0.75 Æ 0.21
847.46 Æ 1.00
e
Fe
163.94 Æ 6.52
57.50 Æ 3.90
5264.49 Æ 59.64
f
Pb
BDL
0.23 Æ 0.04
31.22 Æ 1.14
g
Cd
BDL
0.13 Æ 0.10
–
h
Ni
1.17 Æ 0.047
0.31 Æ 0.03
15.60 Æ 0.54
All values are mean (n ¼ 3) Æ SD in mg kg
À1
/mg l
À1 except color intensity (Pt-Co unit); pH;
EC (μs cm
À1
); BOD biological oxygen demand, COD chemical oxygen demand, TS total solids,
TDS total dissolved solids, VS volatile solids, BDL below detection limit
Chandra and Kumar (2017b), Chandra et al. (2012), Chandra et al. (2018b), Bharagava and Chandra
(2010a, b)
500
V. Kumar and R. Chandra
wasted per day in India (Kansal et al. 1998). On disposal of distillery sludge in the
aquatic and terrestrial ecosystem, it upsets natural food chains, immobilizes soil
nutrients, depresses microbial activity, and affects microflora and macrofauna as
well as human health. However, in nature, this toxic distillery sludge is slowly
converted into a soil amendment (compost) by microflora and/or macrofauna;
therefore, their use singly or in combination is popular nowadays for rapid recycling
of nutrients of distillery waste. The sludge environments could be effective incubators of a wide variety of resistant and adapted bacterial communities and should offer
an ideal source of potential ligninolytic enzyme producing potential bacteria suitable
for related industrial applications (Kumar and Chandra 2018; Chandra and Kumar
2017a). Consequently, investigations of distillery sludge bacterial communities and
its organic compounds have been reported.
Table 20.1 Physicochemical characteristics of melanoidins containing distillery waste
S. No.
Parameter
Distillery waste
Spent wash
PMDE
Distillery sludge
1.
Color intensity
150000
80,000 Æ 2127
–
2.
pH
4.07
8.5 Æ 0.17
8.1 Æ 0.00
3.
EC
–
–
4.12 Æ 0.01
4.
BOD
42000 Æ 1848
9800 Æ 160
–
5.
COD
90000 Æ 3600
18700 Æ 321
–
6.
TS
103084 Æ 5150
47422 Æ 336
–
7.
TDS
77776 Æ 3768
17,612 Æ 284
–
8.
Chloride
2200 Æ 105
1272.74 Æ 5.13
9.
Total nitrogen
2800 Æ 130
4096 Æ 218
–
11.
Phenol
4.20 Æ 1.8
6893 Æ 147
501.34 Æ 1.22
12.
Sulfate
5760 Æ 260
2786 Æ 112
145.07 Æ 0.68
13.
Phosphate
5.36 Æ 0.168
1625 Æ 108
2268.83 Æ 1.70
14.
Trace Elements
a
Mn
4.55 Æ 0.159
43.63 Æ 3.41
238.47 Æ 0.83
b
Cr
1.05 Æ 0.031
–
–
c
Zn
2.48 Æ 0.094
1.24 Æ 0.20
43.47 Æ 1.31
d
Cu
0.33 Æ 0.016
0.75 Æ 0.21
847.46 Æ 1.00
e
Fe
163.94 Æ 6.52
57.50 Æ 3.90
5264.49 Æ 59.64
f
Pb
BDL
0.23 Æ 0.04
31.22 Æ 1.14
g
Cd
BDL
0.13 Æ 0.10
–
h
Ni
1.17 Æ 0.047
0.31 Æ 0.03
15.60 Æ 0.54
All values are mean (n ¼ 3) Æ SD in mg kg
À1
/mg l
À1 except color intensity (Pt-Co unit); pH;
EC (μs cm
À1
); BOD biological oxygen demand, COD chemical oxygen demand, TS total solids,
TDS total dissolved solids, VS volatile solids, BDL below detection limit
Chandra and Kumar (2017b), Chandra et al. (2012), Chandra et al. (2018b), Bharagava and Chandra
(2010a, b)
500
V. Kumar and R. Chandra