

Transitional Peri-urban Landscape …
447
Table 2 Pattern of fishing rights held by the families of the study area
% of HHs with different types of fishing rights
Ancestral Ancestral with
license
Only community
fishing
Domestic
consumption
High urban
37.19
23.44
3.13
36.25
Medium urban 12.5
0
54.17
33.33
Low urban
21.74
0
3.82
74.44
(37%) and industrial waste (28%) as top ranked threats to the lake that is affecting
the fish diversity.
The decrease in fish diversity and production has been evident from the research.
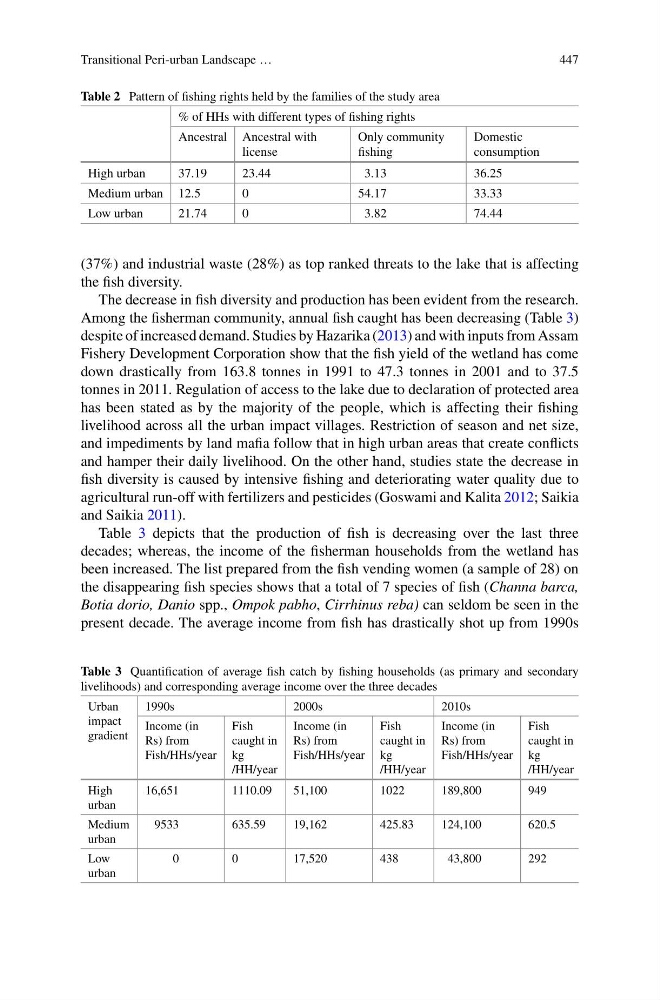
Among the fisherman community, annual fish caught has been decreasing (Table 3)
despite of increased demand. Studies by Hazarika (2013) and with inputs from Assam
Fishery Development Corporation show that the fish yield of the wetland has come
down drastically from 163.8 tonnes in 1991 to 47.3 tonnes in 2001 and to 37.5
tonnes in 2011. Regulation of access to the lake due to declaration of protected area
has been stated as by the majority of the people, which is affecting their fishing
livelihood across all the urban impact villages. Restriction of season and net size,
and impediments by land mafia follow that in high urban areas that create conflicts
and hamper their daily livelihood. On the other hand, studies state the decrease in
fish diversity is caused by intensive fishing and deteriorating water quality due to
agricultural run-off with fertilizers and pesticides (Goswami and Kalita 2012; Saikia
and Saikia 2011).
Table 3 depicts that the production of fish is decreasing over the last three
decades; whereas, the income of the fisherman households from the wetland has
been increased. The list prepared from the fish vending women (a sample of 28) on
the disappearing fish species shows that a total of 7 species of fish (Channa barca,
Botia dorio, Danio spp., Ompok pabho, Cirrhinus reba) can seldom be seen in the
present decade. The average income from fish has drastically shot up from 1990s
Table 3 Quantification of average fish catch by fishing households (as primary and secondary
livelihoods) and corresponding average income over the three decades
Urban
impact
gradient
1990s
2000s
2010s
Income (in
Rs) from
Fish/HHs/year
Fish
caught in
kg
/HH/year
Income (in
Rs) from
Fish/HHs/year
Fish
caught in
kg
/HH/year
Income (in
Rs) from
Fish/HHs/year
Fish
caught in
kg
/HH/year
High
urban
16,651
1110.09
51,100
1022
189,800
949
Medium
urban
9533
635.59
19,162
425.83
124,100
620.5
Low
urban
0
0
17,520
438
43,800
292
447
Table 2 Pattern of fishing rights held by the families of the study area
% of HHs with different types of fishing rights
Ancestral Ancestral with
license
Only community
fishing
Domestic
consumption
High urban
37.19
23.44
3.13
36.25
Medium urban 12.5
0
54.17
33.33
Low urban
21.74
0
3.82
74.44
(37%) and industrial waste (28%) as top ranked threats to the lake that is affecting
the fish diversity.
The decrease in fish diversity and production has been evident from the research.
Among the fisherman community, annual fish caught has been decreasing (Table 3)
despite of increased demand. Studies by Hazarika (2013) and with inputs from Assam
Fishery Development Corporation show that the fish yield of the wetland has come
down drastically from 163.8 tonnes in 1991 to 47.3 tonnes in 2001 and to 37.5
tonnes in 2011. Regulation of access to the lake due to declaration of protected area
has been stated as by the majority of the people, which is affecting their fishing
livelihood across all the urban impact villages. Restriction of season and net size,
and impediments by land mafia follow that in high urban areas that create conflicts
and hamper their daily livelihood. On the other hand, studies state the decrease in
fish diversity is caused by intensive fishing and deteriorating water quality due to
agricultural run-off with fertilizers and pesticides (Goswami and Kalita 2012; Saikia
and Saikia 2011).
Table 3 depicts that the production of fish is decreasing over the last three
decades; whereas, the income of the fisherman households from the wetland has
been increased. The list prepared from the fish vending women (a sample of 28) on
the disappearing fish species shows that a total of 7 species of fish (Channa barca,
Botia dorio, Danio spp., Ompok pabho, Cirrhinus reba) can seldom be seen in the
present decade. The average income from fish has drastically shot up from 1990s
Table 3 Quantification of average fish catch by fishing households (as primary and secondary
livelihoods) and corresponding average income over the three decades
Urban
impact
gradient
1990s
2000s
2010s
Income (in
Rs) from
Fish/HHs/year
Fish
caught in
kg
/HH/year
Income (in
Rs) from
Fish/HHs/year
Fish
caught in
kg
/HH/year
Income (in
Rs) from
Fish/HHs/year
Fish
caught in
kg
/HH/year
High
urban
16,651
1110.09
51,100
1022
189,800
949
Medium
urban
9533
635.59
19,162
425.83
124,100
620.5
Low
urban
0
0
17,520
438
43,800
292